
|
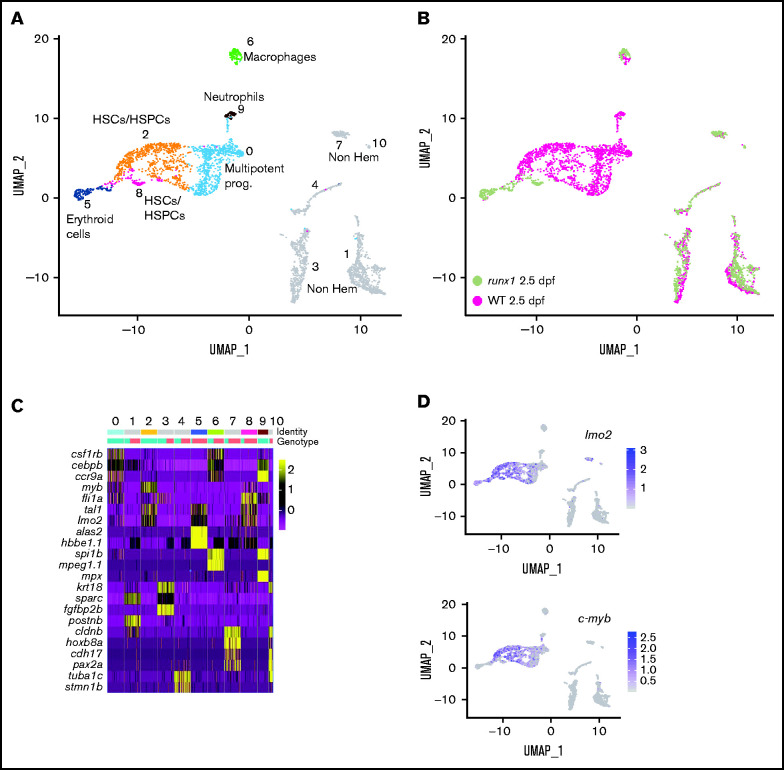
Figure 3.
Single-cell gene expression profile of wild-type and runx1del8/de cd41:GFPlow hematopoietic precursors at 2.5 dpf. (A) UMAP of freshly FACS-isolated cd41:GFPlow cells from wild-type and runx1del8/del8 embryos at 2.5 dpf. Colored clusters represent hematopoietic cells; gray clusters are nonhematopoietic (based on expression profile). (B) UMAP depicting the genotypes of the cd41:GFPlow cells. Mint dots, wild type; magenta dots, runx1del8/del8. (C) Heat map depicting the expression of signature genes representative of different cell identities. The horizontal bars on the top correspond to the clusters identified in panel A (Identity) and show the distribution of the 2 genotypes (Genotype) across the clusters. One hundred representative cells per clusters are shown. (D) Feature plots depicting the expression level of the HSC markers c-myb and lmo2 (purple is high, gray is low). See also supplemental Figure 2 for additional scRNA-seq data from 2.5-dpf embryos.