
- Title
-
RNA-induced inflammation and migration of precursor neurons initiates neuronal circuit regeneration in zebrafish
- Authors
- Vandestadt, C., Vanwalleghem, G.C., Khabooshan, M.A., Douek, A.M., Castillo, H.A., Li, M., Schulze, K., Don, E., Stamatis, S.A., Ratnadiwakara, M., Änkö, M.L., Scott, E.K., Kaslin, J.
- Source
- Full text @ Dev. Cell
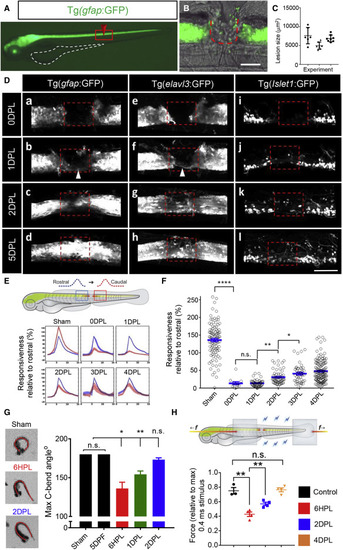
Figure 1. Rapid cellular, circuit, and functional recovery after spinal cord injury (A) Lateral view of a gfap:GFP larva at 3 dpf. Yolk sac outlined in white; the red box shows the field of view in (B). (B) Surgery at the level of the anal pore entirely ablates the spinal cord, scale bar, 100 μm. (C) Quantification of the lesion shows high reproducibility of the injury size between experiments. (D) Live imaging of glial gfap:GFP and neuronal elavl3:GFP, isl1:GFP transgenic reporters demonstrating rapid regenerative response of diverse cell types following injury. The lesion site is indicated by dashed box. At 1–2 DPL, neuronal and glial bridging and a small number of neurons within the lesion site. At 5 DPL, the neuronal and glial tissue architecture was largely restored. (E) Quantification of GCaMP6s fluorescence (ΔF) rostral (blue) and caudal (red) to the site of injury at 0–4 DPL. n was; uninjured = 9, 0DPL = 3, 1-4DPL = 5. (F) Neural activity downstream of injury represented as % relative to the equivalent upstream response over time. (G) Dorsal view of the evoked C-bend angle. Complete 180° response in intact larvae, reduced in 6HPL (24%), 1 DPL (14%) larvae and recovered by 2 DPL. (H) Schematic of muscle force recording. Force was measured between the clips (gray boxes). A significant improvement in force production by 2 DPL (0.4 ms pulse stimulus), n = 4–20 larvae, error = SEM (standard error of the mean), n.s., not significant, ∗p < 0.05, ∗∗p < 0.01, ∗∗∗∗p < 0.0001. Dorsal is up and rostral is left in all images. |
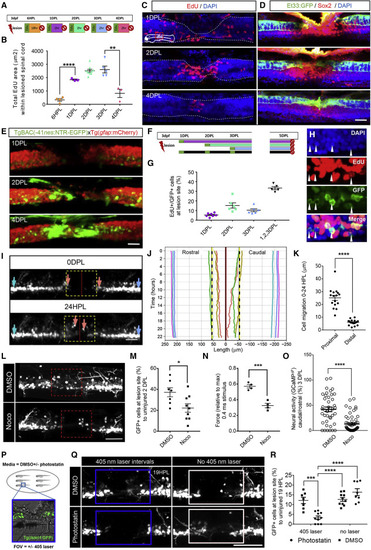
Figure 2. Tissue remodeling and regenerative neurogenesis contribute to neuronal repair after spinal cord injury in distinct temporal phases (A) Design of pulse-chase experiments; each day after injury, larvae were pulsed with EdU (1 h) and chased for the shown time. Representative images shown in (C). (B) Quantification of proliferation within the spinal cord after injury showing peak in proliferation at 2–3 DPL. (C) Representative maximum projections showing the temporal dynamics of EdU+ cells after injury. At 1DPL, EdU+ cells are located around the central canal and at 2–4 DPL, at the stumps and injury sites. The spinal cord is outlined with a white line. (D) Immunostaining showing upregulation of Sox2 along the central canal in proximal stumps at 1 DPL and injury site during 2–4 DPL (control in Figure S4). sqET33:GFP labels roof plate cells (green). Scale bar 50 μm. (E) Expression of the NSPC marker nestin after injury showing that nes:EGFP becomes detectable at the proximal stumps and at the injury site first 2–4 DPL. (F) Experimental design for the long pulse-chase neurogenesis experiment in isl1:GFP larvae. Fish were immersed in EdU for 1 h and chased until 5 DPL. (G) Quantification of EdU+/isl1:GFP+ cells (%) within the lesion site at 5 DPL. (H) Representative maximal projection of the cumulative pulse-chase. White arrow heads show isl1:GFP+/EdU− cells at the lesion site. (I) In vivo maximum projections at the lesion site in isl1:GFP at 0 and 22HPL (Video S4). Individual cells traced in (J) are shown by corresponding colored arrows. (J) Individual tracks of selected cells from time lapse in (I).The y axis represents time (H) and the x axis represents the distance along the length axis of the spinal cord relative to the lesion center. (K) Quantification of cell movement 0–22HPL showing increased recruitment of proximal cells compared with distal. n = 3–4 cells/segment/fish, n = 4 fish. Scale bar 50 μm. (L) Maximum projection images of control and nocodazole (Noco)-treated isl1:GFP fish at 2 DPL showing few cells or processes at the lesion site (red box). (M) Quantification of cells isl1:GFP+ cells at the lesion site showed a decreased number of cells after Noco treatment at 2 DPL, but Noco treatment did not alter cell proliferation (Figure S2N). (N) Quantifying force generation in SCL larvae treated with Noco compared with control 2. A 43% reduction in force production was detected in Noco-treated fish, n = 4. (O) Quantification of GCaMP6s ΔF caudal to injury at 3 DPL showed significantly reduced neural activity in fish treated with Noco. (P) Overview of the photostatin experiment. Injured larvae were immersed with 10 μM or vehicle control and exposed to 405-nm light (blue box) to activate the compound at the lesion site. (Q) Representative maximum projection images of isl1:GFP fish treated with vehicle or photostatin. (R) Quantification of isl1:GFP cells at the lesion site showing significantly reduced number of cells in the photoactivated photostatin cohort compared with controls (n = 3–9 larvae, error = SEM (standard error of the mean), ∗∗p < 0.01, ∗∗∗p < 0.001, ∗∗∗∗p < 0.0001). |
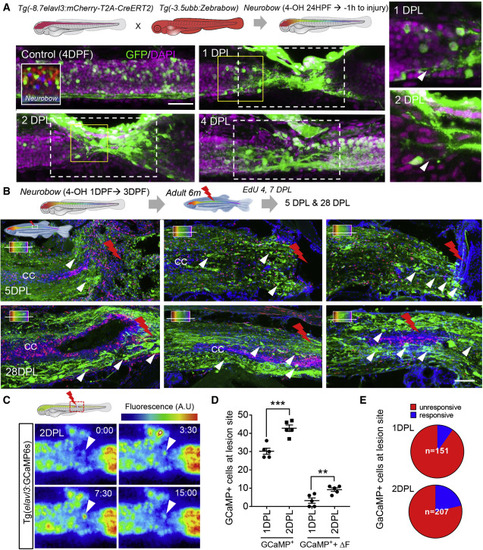
Figure 3. Tissue remodeling and cell migration drive the early phase of spinal cord regeneration (A) Recombination of neurons during embryonic development using Neurobow. Embryos were treated with 4-OH from early neurogenesis (24 hpf) until 1 h before injury. Maximum projection images at the injury site at 1, 2, and 4 DPL showing embryonically produced neurons (green) and their processes (white arrowhead) recruited rapidly to the injury site. (B) SCL in adult Neurobow fish at 6 months (embryonically recombined as in A). Fish received EdU 4 and 7 DPL and were analyzed at 5 and 28 DPL. Horizontal sections at different levels of the spinal cord demonstrating recruitment of embryonically produced neurons (green) to the lesion site (white arrowhead) in addition to the non-overlapping newly produced cells labeled with EdU (Red). (C) Snapshot at 2 DPL of a time-lapse movie showing the first ΔF active neurons at the lesion site, white arrowhead, (Video S3). Times in S:ms. (D and E) Quantification of neurons and active neurons (ΔF) at the lesion site between 1–2 DPL (n = 5 for each time point). The proportion of active neurons is low at 1 DPL (9.8%) and increases at 2 DPL (21.4%). Error = SEM, ∗∗p < 0.01, ∗∗p < 0.001. |
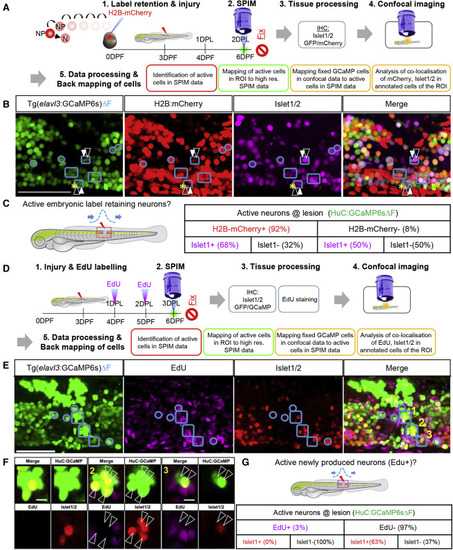
Figure 4. Role of pre-existing versus newly produced neurons in pioneering local circuit regeneration after spinal cord injury (A) Experimental design of a label retention assay to identify the contribution of embryonically produced neurons in pioneering circuit function. elavl3:H2B-GCaMP6s embryos were injected with H2B-mCherry mRNA. Neurons produced during development (N) retain mCherry expression, whereas neural progenitors (NP) that proliferate dilute the label with each round of division. At 2 DPL, larvae were imaged to identify actively firing neurons (ΔF) at the lesion site. Additionally, high-resolution images were taken, followed by fixation, Islet1/2 immunostaining, and confocal imaging. The active neurons were identified by defining active regions of interest (ROIs) within the lesion site and correlating the data to confocal data with mCherry+ cells (label retention) and Islet1/2+ cells (post-mitotic ventral marker). (B) Mapping of ΔF active ROIs (outlined in blue) to define the identity of actively firing cells at the lesion site at 2 DPL. Active ROIs may contain H2B-mCherry+ or H2B-mCherry− cells (white-filled arrowheads and white-outlined arrowheads, respectively). (C) Quantification of different cell types within the ΔF active ROIs (details in Figure S4) showing that the majority of the active neurons at the lesion were produced in the embryo. (D) Experimental design to identify the role of newly produced neurons after injury. Following injury at 3 dpf, elavl3:H2B-GCaMP6s fish were pulsed with EdU at 1 and 2 DPL. At 3 DPL, larvae were imaged to acquire GCaMP6sΔF data and high-resolution images, then fixed for staining. (E) ΔF active ROIs at the lesion were mapped onto the confocal data (outlined in blue) with EdU-labeled cells (newly produced cells) and Islet1/2 immunostaining. Active ROI cell clusters may contain cells that are EdU+ or EdU− (white-filled arrowheads and white-outlined arrowheads, respectively). The merge panel shows GCaMP, Islet1/2, and EdU cells. Yellow numbers refer to images in (F). (F) High magnification of ΔF active ROIs in E showing that active neurons do not co-localize with EdU+ cells (white open arrow heads) or Islet1/2+ cells. (G) Quantification of marker expression within ΔF active ROIs (details in Figure S4) showing that newly produced cells very rarely contribute to the functional circuitry at 3 DPL. Scale bar, 50μm. |
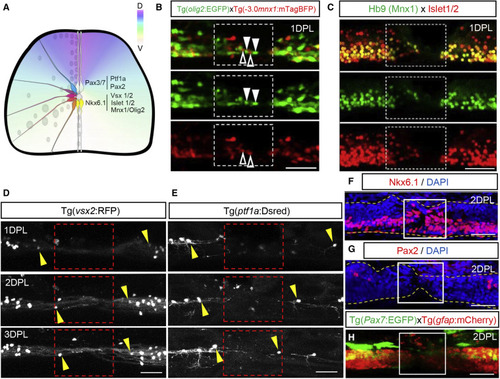
Figure 5. Molecular characteristics of neurons rapidly recruited to the injury (A) Schematic cross section of the spinal cord showing dorsoventral domains. (B) Maximum projection side views of olig2:EGFP (green) and mnx1:mTagBFP (red) fish at 1 DPL showing recruitment of ventral cell lineages to the injury. Arrowheads downward show olig2:EGFP+ cells and arrowheads upward show mnx1:mTagBFP+ neurons. (C) Hb9 (Mnx1) and Islet1/2 immunohistochemistry showing recruitment of ventral cells to the injury at 1 DPL. (D) Sagittal view showing slow recruitment of interneurons expressing vsx2:RFP to the lesion site between 1–3 DPL. (E) Sagittal view showing marginal recruitment of dorsal inhibitory sensory neurons using the ptf1a:DsRed reporter between 1–3 DPL. (F and G) Sagittal view showing abundant Nkx6.1+ but no Pax2+ immunolabelled cells at the lesion site 2 DPL. Spinal cord boundaries are outlined in yellow. (H) Maximum projection of pax7a:EGFP labeling dorsal cell lineages at 2 DPL. The lesion site is outlined in white and is devoid of GFP+ cells. Scale bar, 50 μm. |
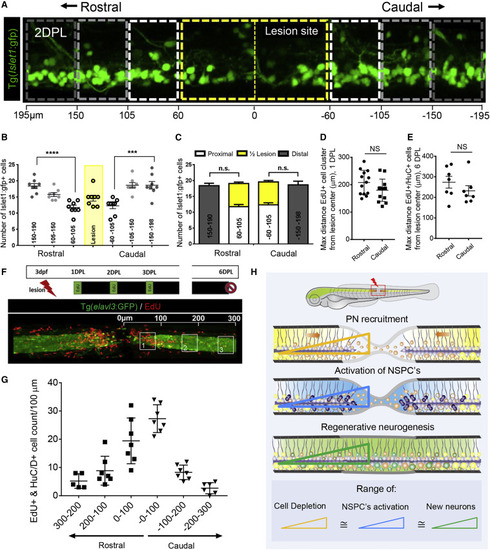
Figure 6. Precursor neuron recruitment shapes the NSPC and regenerative neurogenesis response (A) Sagittal view of 2 DPL isl1:GFP larvae showing recruited cells and depletion from proximal stumps. The lesion site is outlined by a yellow dashed line. Distal segments (bins) are outlined in white to gray. The scale bar indicates the distance in μm from the lesion center. (B) Total isl1:GFP+ cell count at 2 DPL within defined bins of the lesion. The isl1:GFP+ cell count was proportionally reduced with proximity to the injury. (C) Quantification of isl1:GFP+ cells within the lesion site at 2 DPL and comparison with cell counts proximal to the lesion showed that the majority of cells were recruited from the proximal segments to a distance of 200 μm. (D) Proliferating EdU+ cell clusters at 1 DPL were found at 208 and 180 μm max distance from the lesion center for rostral and caudal stumps, respectively. Clusters are defined as 3 or more cells within 10 μm. (E) Mean maximal distance from the lesion site of newborn neurons (EdU+/elavl3:EGFP+) at 6 DPL were found at 274 and 232 μm for the rostral and caudal domains, respectively. (F) Sagittal view of newborn neurons (EdU+/elavl3:EGFP+) from cumulative EdU pulse-chase at 6 DPL, scale bar, 100 μm. (G) Quantification of newborn neurons within 100-μm bins from the lesion center showing an inverse relationship between the increasing distance from the center and the number of newborn neurons. (H) Schematic representation of compensatory neurogenic response illustrating that the proximal area of cell recruitment (depletion) corresponds to the region of NSPC proliferation and neural regeneration. |
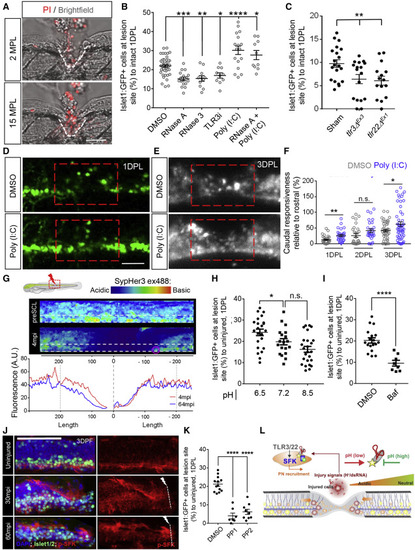
Figure 7. An RNA-induced inflammatory response mediates tissue regeneration and precursor neuron recruitment (A) Maximum projection of the injury site at 2 and 15 min post lesion (MPL), showing propidium iodide (PI) uptake in cells at the injury site. Lesion shown with white line. (B) Quantification of isl1:GFP+ cells at 1 DPL relative to control (DMSO) following RNase A, RNase III, TLR3i, poly(I:C), or RNase A, followed by poly(I:C) treatment (C) Quantification of isl1:GFP+ cells at 1 DPL relative to control siblings in tlr3 and tlr22 mutants with deleted RNA-binding domains. (D) Maximum projection of poly(I:C)-treated fish at 1 DPL showing a significant boost in the recruitment of isl1:GFP+ cells to the lesion site. (E and F) Quantification of neural activity using GCaMP6sΔF following poly(I:C) treatment showing enhanced recruitment of neurons and improved neural activity downstream of the injury compared with control. (G) Measurement of local pH changes in response to injury using the in vivo pH indicator Sypher3. The white outline shows region of analysis in the bottom panel and the red circle shows cells analyzed in Figures S7J and S7K. Bottom panel; intensity plot for ventral cell population at 4 (red) and 64 (blue) min postinjury (MPI) showing a rapid drop in pH in proximity to injury. (H) Quantification of isl1:GFP+ cells following treatment with different pH in media showing that an acidic environment after injury increases the number of isl1:GFP+ cells in the lesion site compared with neutral pH. (I) Quantification of isl1:GFP+ cells at injury site 1 DPL, following bafilomyocin-A1 (Baf) treatment, showing a reduction in isl1:GFP+ cell recruitment in Baf-treated fish compared with vehicle control. (J) Representative maximum projection images of pSFK-immunostained isl1:GFP in intact and injured larvae. (K) Quantification of isl1:GFP+ cells at 1 DPL following the inhibition of SFK signaling using PP1 or PP2. (L) Scheme showing that the acidic cellular environment created by injury facilitates interaction of dsRNA with TLRs, which, in turn, activates SFK phosphorylation and promotes rapid migration of isl1:GFP+ cells to the lesion. Error = SEM, n.s., not significant, ∗p < 0.05, ∗∗p < 0.01, ∗∗∗p < 0.001, ∗∗∗∗p < 0.0001 Scale bar, 50 μm, dorsal up and rostral left. |
Reprinted from Developmental Cell, 56, Vandestadt, C., Vanwalleghem, G.C., Khabooshan, M.A., Douek, A.M., Castillo, H.A., Li, M., Schulze, K., Don, E., Stamatis, S.A., Ratnadiwakara, M., Änkö, M.L., Scott, E.K., Kaslin, J., RNA-induced inflammation and migration of precursor neurons initiates neuronal circuit regeneration in zebrafish, 2364-2380.e8, Copyright (2021) with permission from Elsevier. Full text @ Dev. Cell