
Fig. 2
- ID
- ZDB-IMAGE-221011-2
- Publication
- Vandestadt et al., 2021 - RNA-induced inflammation and migration of precursor neurons initiates neuronal circuit regeneration in zebrafish
- All Figures
- Figures for Vandestadt et al., 2021
|
Fig. 2
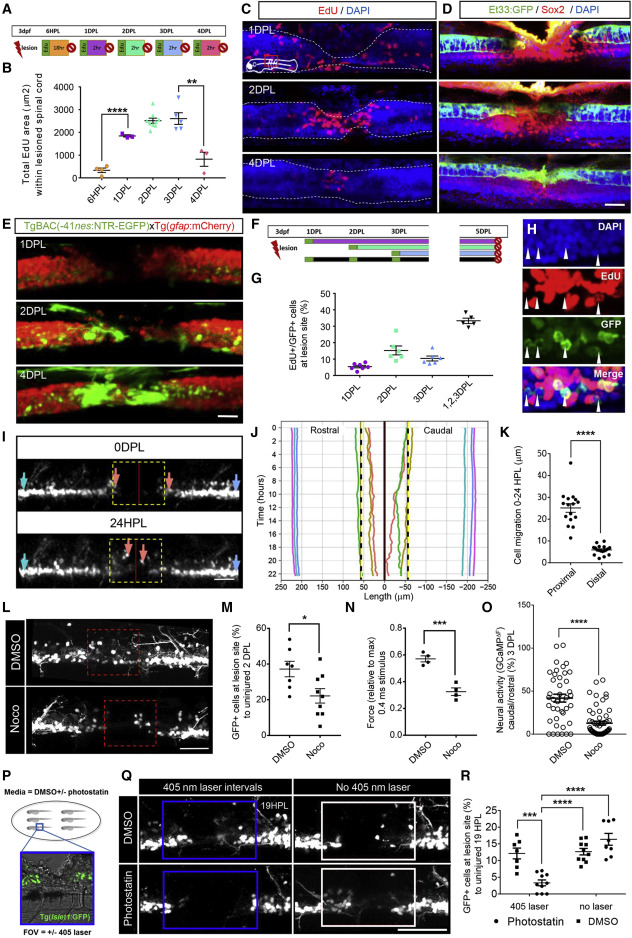
Figure 2. Tissue remodeling and regenerative neurogenesis contribute to neuronal repair after spinal cord injury in distinct temporal phases (A) Design of pulse-chase experiments; each day after injury, larvae were pulsed with EdU (1 h) and chased for the shown time. Representative images shown in (C). (B) Quantification of proliferation within the spinal cord after injury showing peak in proliferation at 2–3 DPL. (C) Representative maximum projections showing the temporal dynamics of EdU+ cells after injury. At 1DPL, EdU+ cells are located around the central canal and at 2–4 DPL, at the stumps and injury sites. The spinal cord is outlined with a white line. (D) Immunostaining showing upregulation of Sox2 along the central canal in proximal stumps at 1 DPL and injury site during 2–4 DPL (control in Figure S4). sqET33:GFP labels roof plate cells (green). Scale bar 50 μm. (E) Expression of the NSPC marker nestin after injury showing that nes:EGFP becomes detectable at the proximal stumps and at the injury site first 2–4 DPL. (F) Experimental design for the long pulse-chase neurogenesis experiment in isl1:GFP larvae. Fish were immersed in EdU for 1 h and chased until 5 DPL. (G) Quantification of EdU+/isl1:GFP+ cells (%) within the lesion site at 5 DPL. (H) Representative maximal projection of the cumulative pulse-chase. White arrow heads show isl1:GFP+/EdU− cells at the lesion site. (I) In vivo maximum projections at the lesion site in isl1:GFP at 0 and 22HPL (Video S4). Individual cells traced in (J) are shown by corresponding colored arrows. (J) Individual tracks of selected cells from time lapse in (I).The y axis represents time (H) and the x axis represents the distance along the length axis of the spinal cord relative to the lesion center. (K) Quantification of cell movement 0–22HPL showing increased recruitment of proximal cells compared with distal. n = 3–4 cells/segment/fish, n = 4 fish. Scale bar 50 μm. (L) Maximum projection images of control and nocodazole (Noco)-treated isl1:GFP fish at 2 DPL showing few cells or processes at the lesion site (red box). (M) Quantification of cells isl1:GFP+ cells at the lesion site showed a decreased number of cells after Noco treatment at 2 DPL, but Noco treatment did not alter cell proliferation (Figure S2N). (N) Quantifying force generation in SCL larvae treated with Noco compared with control 2. A 43% reduction in force production was detected in Noco-treated fish, n = 4. (O) Quantification of GCaMP6s ΔF caudal to injury at 3 DPL showed significantly reduced neural activity in fish treated with Noco. (P) Overview of the photostatin experiment. Injured larvae were immersed with 10 μM or vehicle control and exposed to 405-nm light (blue box) to activate the compound at the lesion site. (Q) Representative maximum projection images of isl1:GFP fish treated with vehicle or photostatin. (R) Quantification of isl1:GFP cells at the lesion site showing significantly reduced number of cells in the photoactivated photostatin cohort compared with controls (n = 3–9 larvae, error = SEM (standard error of the mean), ∗∗p < 0.01, ∗∗∗p < 0.001, ∗∗∗∗p < 0.0001).
Reprinted from Developmental Cell, 56, Vandestadt, C., Vanwalleghem, G.C., Khabooshan, M.A., Douek, A.M., Castillo, H.A., Li, M., Schulze, K., Don, E., Stamatis, S.A., Ratnadiwakara, M., Änkö, M.L., Scott, E.K., Kaslin, J., RNA-induced inflammation and migration of precursor neurons initiates neuronal circuit regeneration in zebrafish, 2364-2380.e8, Copyright (2021) with permission from Elsevier. Full text @ Dev. Cell