
- Title
-
Live imaging of adult zebrafish cardiomyocyte proliferation ex vivo
- Authors
- Honkoop, H., Nguyen, P.D., van der Velden, V.E.M., Sonnen, K.F., Bakkers, J.
- Source
- Full text @ Development

|
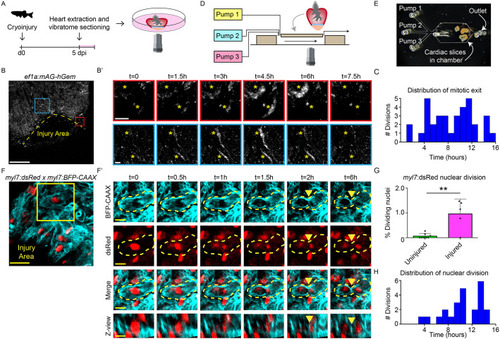
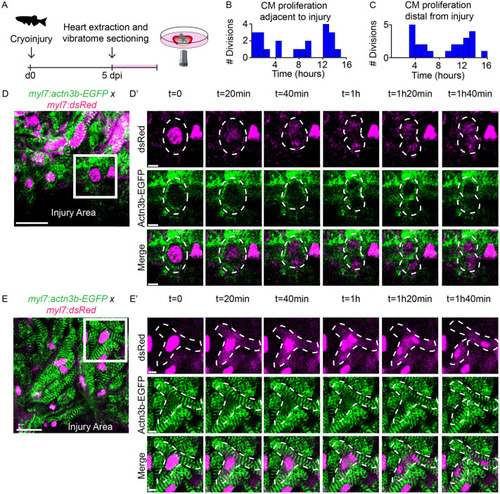
Cardiomyocyte proliferation during live imaging in cardiac slices. (A) Schematic representation of workflow. (B,B′) Time-lapse imaging on cardiac slices from 5 dpi Tg(ef1α:mAg-hGem) hearts, to visualize cells that enter G2/M phase. Yellow dotted line indicates the injury area. Asterisks mark cells in zoom-ins with dynamic geminin expression. Scale bars: 200 µm (overview); 20 µm (zoom). (C) Histogram showing distribution of mitotic exit in Tg(EF1α:mAg-hGem) cardiac slices over time. (D) Schematic representation of microfluidic chip design. (E) Bright-field image of cardiac slices inside the microfluidic chamber. (F,F′) Time-lapse imaging on 5 dpi cardiac slices from Tg(myl7:dsRed;myl7:BFP-CAAX) fish. Cardiomyocytes expressing nuclear dsRed are shown in red and membrane-bound BFP-CAAX is shown in cyan. Yellow dotted line indicates cellular outline. Yellow arrowheads indicate the membrane splitting two daughter cells. Scale bars: 25 µm (overview); 10µm (zoom). (G) Quantification of nuclear divisions during time-lapse imaging on Tg(myl7:dsRed) injured and uninjured slices. Each dot represents a result from one cardiac slice. Data are mean±s.d. (H) Histogram showing distribution of cardiomyocyte nuclear division. **P<0.01. |
|
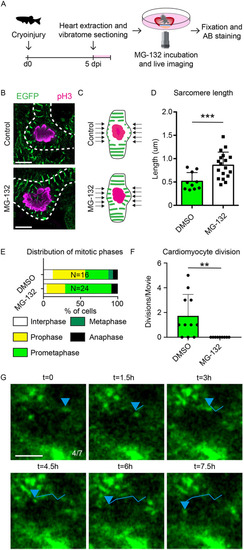
The proteasome and calpain inhibitor MG-132 blocks sarcomere disassembly and proliferation. (A) Schematic of experiments in B-H. (B) Confocal images of prometaphase cells from control and MG-132-treated cardiac slices. Mitotic nuclei are marked with pH3 (magenta) and sarcomeres are marked with Actn3b-EGFP (green). Dotted lines represent cellular outlines. Scale bar: 5 µm. (C) Schematic representation of sarcomere length quantification. The length of sarcomeres around the nucleus, indicated by arrows, was measured for quantification. (D) Quantification of sarcomere length surrounding prometaphase nuclei. Each dot represents a result from a single cell. Data are mean±s.d. (E) Distribution of mitotic phases in pH3+ cells in cardiac slices. (F) Quantification of cardiomyocyte divisions per time-lapse movie in the presence of DMSO or MG-132. Each dot represents a result from one time-lapse movie. Data are mean±s.d. (G) Tracking of sarcomere fragments in a cardiomyocyte directly adjacent to the injury during MG-132 treatment. Positions of sarcomere fragment are indicated by a blue arrowheads. Tracks are shown by lines. Scale bar: 5 µm. **P<0.01. ***P<0.001. |