|
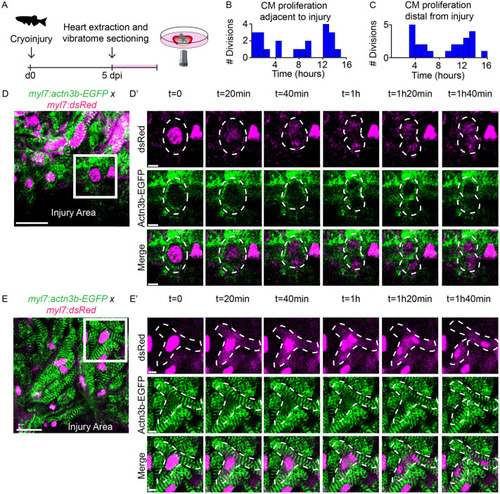
Dynamics of sarcomere structures during cardiomyocyte proliferation. (A) Schematic representation of workflow. (B,C) Histogram showing the distribution of proliferation during time-lapse imaging in cardiomyocytes directly adjacent to the injury (B) or more distal to the injury (C). (D-E′) Overview images (D,E) and zoom-ins (D′,E′) of time-lapse imaging on 5 dpi Tg(myl7:actn3b-EGFP; myl7:DsRed) cardiac slices capturing cardiomyocyte proliferation directly adjacent to the injury (D,D′) or distal to the injury (E,E′). Cardiomyocyte nuclei marked by dsRed are shown in magenta; sarcomeric structures marked by Actn3b-EGFP are shown in green. Dotted lines indicate cellular outlines. Scale bars: 20 µm (overview); 5 µm (zoom).
|