
Fig. 2.
- ID
- ZDB-FIG-211009-52
- Publication
- Honkoop et al., 2021 - Live imaging of adult zebrafish cardiomyocyte proliferation ex vivo
- Other Figures
- All Figure Page
- Back to All Figure Page
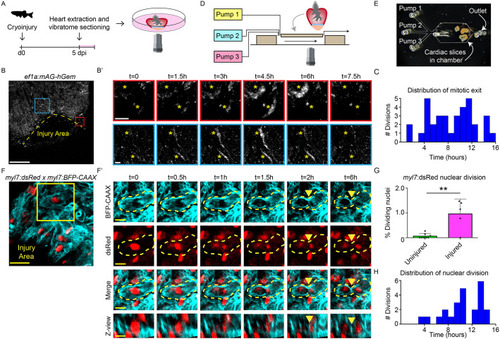
Cardiomyocyte proliferation during live imaging in cardiac slices. (A) Schematic representation of workflow. (B,B′) Time-lapse imaging on cardiac slices from 5 dpi Tg(ef1α:mAg-hGem) hearts, to visualize cells that enter G2/M phase. Yellow dotted line indicates the injury area. Asterisks mark cells in zoom-ins with dynamic geminin expression. Scale bars: 200 µm (overview); 20 µm (zoom). (C) Histogram showing distribution of mitotic exit in Tg(EF1α:mAg-hGem) cardiac slices over time. (D) Schematic representation of microfluidic chip design. (E) Bright-field image of cardiac slices inside the microfluidic chamber. (F,F′) Time-lapse imaging on 5 dpi cardiac slices from Tg(myl7:dsRed;myl7:BFP-CAAX) fish. Cardiomyocytes expressing nuclear dsRed are shown in red and membrane-bound BFP-CAAX is shown in cyan. Yellow dotted line indicates cellular outline. Yellow arrowheads indicate the membrane splitting two daughter cells. Scale bars: 25 µm (overview); 10µm (zoom). (G) Quantification of nuclear divisions during time-lapse imaging on Tg(myl7:dsRed) injured and uninjured slices. Each dot represents a result from one cardiac slice. Data are mean±s.d. (H) Histogram showing distribution of cardiomyocyte nuclear division. **P<0.01. |