
Fig. 4.
- ID
- ZDB-FIG-211009-54
- Publication
- Honkoop et al., 2021 - Live imaging of adult zebrafish cardiomyocyte proliferation ex vivo
- Other Figures
- All Figure Page
- Back to All Figure Page
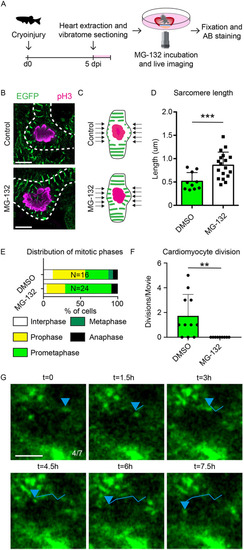
The proteasome and calpain inhibitor MG-132 blocks sarcomere disassembly and proliferation. (A) Schematic of experiments in B-H. (B) Confocal images of prometaphase cells from control and MG-132-treated cardiac slices. Mitotic nuclei are marked with pH3 (magenta) and sarcomeres are marked with Actn3b-EGFP (green). Dotted lines represent cellular outlines. Scale bar: 5 µm. (C) Schematic representation of sarcomere length quantification. The length of sarcomeres around the nucleus, indicated by arrows, was measured for quantification. (D) Quantification of sarcomere length surrounding prometaphase nuclei. Each dot represents a result from a single cell. Data are mean±s.d. (E) Distribution of mitotic phases in pH3+ cells in cardiac slices. (F) Quantification of cardiomyocyte divisions per time-lapse movie in the presence of DMSO or MG-132. Each dot represents a result from one time-lapse movie. Data are mean±s.d. (G) Tracking of sarcomere fragments in a cardiomyocyte directly adjacent to the injury during MG-132 treatment. Positions of sarcomere fragment are indicated by a blue arrowheads. Tracks are shown by lines. Scale bar: 5 µm. **P<0.01. ***P<0.001. |