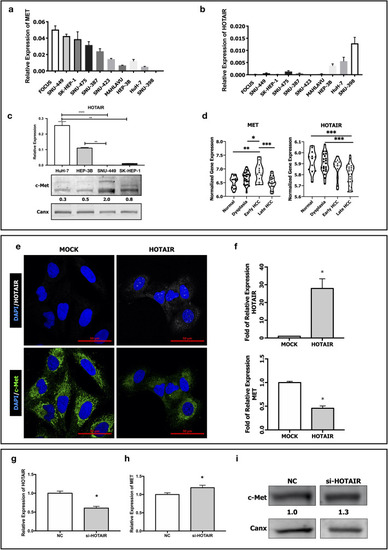
Expression of HOTAIR and c-Met in HCC cell lines and patient tissues through HCC progression. RT-qPCR analysis of (a) MET and (b) HOTAIR expressions in HCC cell lines FOCUS, SNU-449, SK-HEP-1, SNU-475, SNU-387, SNU-423, MAHLAVU, Hep-3B, HuH-7 and SNU-398. (c) RT-qPCR analysis of HOTAIR expression and immunoblotting of c-Met protein in HuH-7, Hep-3B, SNU-449 and SK-HEP-1 cells. (d) Normalized expression levels of MET and HOTAIR in normal, dysplasia, early and late HCC tissues in microarray dataset GSE89377. (e) Confocal microscopy image of fluorescent-in-situ hybridized HOTAIR mRNA and immunofluorescent labeled c-Met protein expression in control (MOCK) and HOTAIR over-expressing (HOTAIR OE) SNU-449 cells. RT-qPCR analysis of (f) MET and HOTAIR mRNA expression in MOCK and HOTAIR OE clones. RT-qPCR analysis of (g) HOTAIR and (h) c-Met mRNA expression in control si-RNA (NC) and si-HOTAIR transfected HuH-7 cells. Western blot analysis of (i) c-Met protein expression in control (NC) and si-HOTAIR transfected HuH-7 cells. Densitometric analysis of band intensities in immunoblots were analyzed with ImageJ and normalized with internal control protein band intensities. All graphs of experiments are presented as the mean ± SEM of at least 3 independent experiments. * p ≤ 0.05, ** p ≤ 0.01, *** p ≤ 0.001, **** p ≤ 0.0001

Effect of HOTAIR overexpression in c-Met downstream signaling. Analysis of c-Met and downstream signaling in MOCK and HOTAIR OE cells. Immunoblot analysis of (a) c-Met protein expression, c-Met activation phosphorylation (Tyr-1234/Tyr-1235); (b) Akt1 protein expression, Akt1 activation phosphorylation (Ser-473); (c) Erk1/2 protein expression, Erk1/2 activation phosphorylation (Thr-202/Tyr-204); (d) STAT3 protein expression and activation phosphorylation (Tyr-705). Column graph of corrected total cell fluorescence of c-Met immunofluorescent staining (e). Immunofluorescence imaging of (f) total c-Met protein (red) and its activation (green). RT- qPCR analysis of (g) CAV1 mRNA expression, immunoblotting of (h) Caveolin-1 protein and its activation phosphorylation (Tyr-14) and column graph of densitometric analysis of Caveolin-1 activation and total protein expressions. Immunoblotting of (i) Src kinase expression and its activation phosphorylation (Tyr-416). Immunofluorescence imaging of (j) total Caveolin-1 protein (red) and its activation (green). DAPI (blue) was used as a nuclear marker in immunofluorescent images. Densitometric analysis of band intensities in immunoblots were analyzed with ImageJ and normalized with internal control protein band intensities. All graphs of experiments are presented as the mean ± SEM of at least 3 independent experiments. * p ≤ 0.05, ** p ≤ 0.01, *** p ≤ 0.001, **** p ≤ 0.0001

Analysis of HOTAIR-c-Met interaction in MET overexpressed, activated and inhibited conditions. Immunoblotting of (a) c-Met activation phosphorylation (Tyr-1234/Tyr-1235), and total c-Met protein expression. Confocal microscopy imaging of (b) c-Met protein and RT-qPCR analysis of c-Met mRNA expression in MET OE SNU-398 clones. (c) Confocal imaging of FISH labeling (white dots) and RT-qPCR analysis of HOTAIR mRNA expression in MET OE clones. (d) Confocal imaging of Caveolin-1 protein and qPCR analysis of CAV1 mRNA expression in MET OE cells. (e) Immunoblot of c-Met activation and qPCR analysis of HOTAIR expression in ligand-dependent activation (HGF 10 ng/ml) of c-Met in HuH-7, HEP-3B, SNU-449, MAHLAVU and SK-HEP-1 cells. RT-qPCR analysis of HOTAIR expression (f), in response to heparin (100 μg/mL) induced c-Met activation in SK-HEP-1 cells. RT-qPCR analysis of MET and HOTAIR expressions in sorafenib resistance (MAHLAVU cell line) (g) and high-glucose (25 mM, HuH-7 cell line) (h) and fluidic shear stress (0.5 dyn/cm2, HuH-7 cell line) (i) induced c-Met activations. (j) Immunoblot of c-Met activation and qPCR analysis of HOTAIR expression in tyrosine kinase activity inhibition of c-Met by SU11274 (2500 nM) HuH-7, SNU-449, MAHLAVU and SK-HEP-1 cells. All graphs of experiments are presented as the mean ± SEM of at least 3 independent experiments. * p ≤ 0.05, ** p ≤ 0.01, *** p ≤ 0.001, **** p ≤ 0.0001

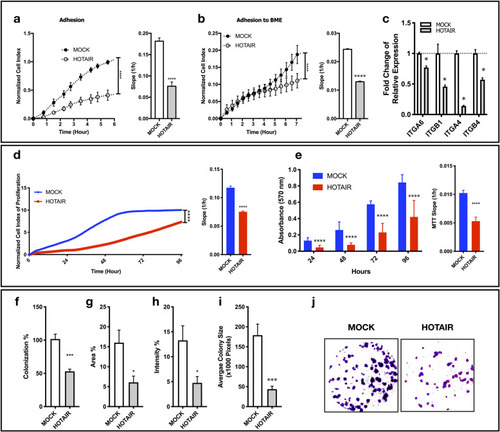
HOTAIR OE induced c-Met inhibition decreases adhesion, proliferation and colony formation. Normalized cell index and slope analysis of adhesion to (a) cell culture treated and (b) basal membrane extract-coated surfaces analyzed with xCELLigence RTCA. (c) RT-qPCR analysis of ITGA6, ITGB1, ITGA4 and ITGB4 expressions. (d) Analysis of normalized cell index and rate (slope) of proliferation by xCELLigence RTCA system. Normalized (e) MTT absorbance (570 nm) and proliferation rate (slope) calculated by MTT absorbance. 2D colony formation analysis of MOCK and HOTAIR clones presented as (f) percentage of colonization, (g) percentage of area covered by colonies, (h) intensity of Giemsa-staining (i) average colony size in pixels and (j) representative images of clones generated with ImageJ plugin ColonyArea. 2D colony formation is analyzed by ImageJ plugin ColonyArea. All graphs of experiments are presented as the mean ± SEM of at least 3 independent experiments. * p ≤ 0.05, ** p ≤ 0.01, *** p ≤ 0.001, **** p ≤ 0.0001

HOTAIR OE induced c-Met inhibition decreases individual motility and invasion ability of SNU-449 cells. Real-time (by xCELLigence RTCA) and end-point (cell culture inserts) analysis of motility and invasion of MOCK and HOTAIR OE cell clones. Normalized cell index of (a) motility and (c) invasion analyzed by xCELLigence RTCA system. Fold change graphs and brightfield images of (b) motile and (d) invaded cells in trans-well cell culture inserts. (e) Brightfield microscopy images of 0-, 24- and 48-h scratch (wound-healing) assay of MOCK and HOTAIR OE clones. All graphs of experiments are presented as the mean ± SE of at least 3 independent experiments. * p ≤ 0.05, **p ≤ 0.01, ***p ≤ 0.001

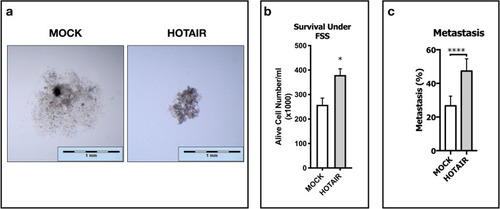
lncRNA HOTAIR suppresses c-Met induced cell scattering, enhances survival under FSS and promotes metastasis in zebrafish embryos. Spheroid formation, survival under fluidic shear stress and metastatic capacity of MOCK and HOTAIR OE cells. (a) Spheroid images were collected with stereo-microscopy and magnified equally with scale-bars to generate more clarified presentation of data. (b) Graphical presentation of alive cell numbers of MOCK and HOTAIR OE clones cultured under 0.5 dyn/cm2 fluidic shear stress for 1 h. Embryonic zebrafish xenograft experiments with MOCK and HOTAIR OE SNU-449 cell clones presented as (c) percentage of metastasis in groups that were analyzed in total of three biological experiments. Statistical significance was analyzed by chi-square with Yates correction. All graphs of experiments are presented as the mean ± SE of at least 3 independent experiments. * p ≤ 0.05, ** p ≤ 0.01, *** p ≤ 0.001, **** p ≤ 0.0001

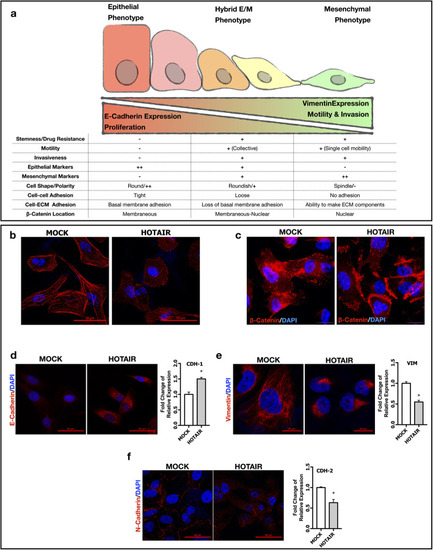
lncRNA HOTAIR maintains hybrid E/M phenotype to promote metastasis. (a) Schematic presentation of morphological, molecular and biological biomarkers of epithelial, mesenchymal and hybrid E/M phenotypes. Confocal imaging of (b) Alexa-555 labeled phalloidin staining of F-actin filaments (red). Immunofluorescence imaging of (c) beta-Catenin protein (red) and its cellular localization. Confocal imaging and RT-qPCR analysis of (d) E-Cadherin (e) Vimentin and (f) N-Cadherin expressions. Alexa-594 conjugated secondary antibodies were used in all immunolabeling and confocal imaging experiments. DAPI (blue) was used as a nuclear marker in immunofluorescence and confocal images. All graphs of experiments are presented as the mean ± SEM of at least 3 independent experiments. * p ≤ 0.05

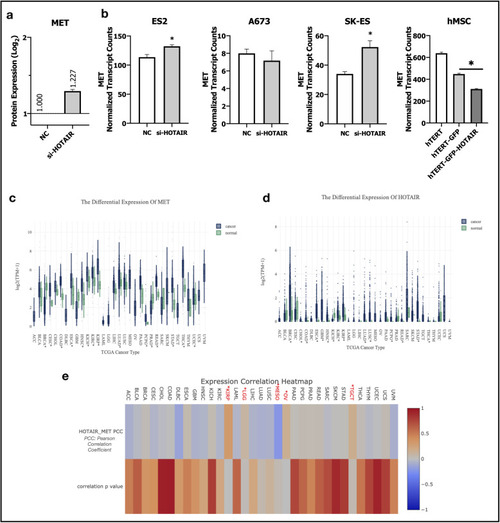
Bioinformatic analyses of GEO and TCGA datasets supports HOTAIR and c-Met interplay. (a) Column graph of c-Met protein expression in control-siRNA and HOTAIR-siRNA transfected HepG2 cells in GEO dataset GSE98091. (b) MET gene expression in experimental groups of GEO dataset GSE109483. Column graphs of control-GapMeR and HOTAIR-GapmeR transfected Ewing sarcoma cell lines ES2, A673 and SK-ES (1st, 2nd and 3rd graphs). Last graph belongs to hTERT-immortalized human mesenchymal stem cells (hMSC), hMSCs transfected with GFP (hTERT-GFP) and HOTAIR-GFP (hTERT-GFP-HOTAIR) overexpression vectors. Analysis of (c) MET (d) HOTAIR gene expressions in TCGA datasets. (e) Heatmap of gene expression correlation analysis of HOTAIR and MET in TCGA datasets. GEO dataset analysis are performed with GREIN and TCGA gene expression and correlation analysis are performed with LncTarD. * p ≤ 0.05

Acknowledgments
This image is the copyrighted work of the attributed author or publisher, and ZFIN has permission only to display this image to its users. Additional permissions should be obtained from the applicable author or publisher of the image. Full text @ Cell Commun. Signal.