FIGURE

Fig. 1

ID
ZDB-FIG-210813-22
Publication
Topel et al., 2020 - lncRNA HOTAIR overexpression induced downregulation of c-Met signaling promotes hybrid epithelial/mesenchymal phenotype in hepatocellular carcinoma cells
Other Figures
All Figure Page
Back to All Figure Page
Fig. 1

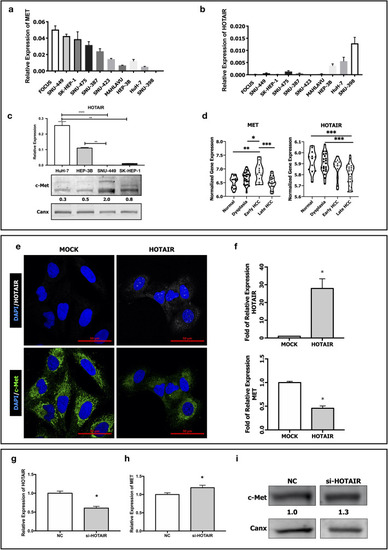
Expression of HOTAIR and c-Met in HCC cell lines and patient tissues through HCC progression. RT-qPCR analysis of (a) MET and (b) HOTAIR expressions in HCC cell lines FOCUS, SNU-449, SK-HEP-1, SNU-475, SNU-387, SNU-423, MAHLAVU, Hep-3B, HuH-7 and SNU-398. (c) RT-qPCR analysis of HOTAIR expression and immunoblotting of c-Met protein in HuH-7, Hep-3B, SNU-449 and SK-HEP-1 cells. (d) Normalized expression levels of MET and HOTAIR in normal, dysplasia, early and late HCC tissues in microarray dataset GSE89377. (e) Confocal microscopy image of fluorescent-in-situ hybridized HOTAIR mRNA and immunofluorescent labeled c-Met protein expression in control (MOCK) and HOTAIR over-expressing (HOTAIR OE) SNU-449 cells. RT-qPCR analysis of (f) MET and HOTAIR mRNA expression in MOCK and HOTAIR OE clones. RT-qPCR analysis of (g) HOTAIR and (h) c-Met mRNA expression in control si-RNA (NC) and si-HOTAIR transfected HuH-7 cells. Western blot analysis of (i) c-Met protein expression in control (NC) and si-HOTAIR transfected HuH-7 cells. Densitometric analysis of band intensities in immunoblots were analyzed with ImageJ and normalized with internal control protein band intensities. All graphs of experiments are presented as the mean ± SEM of at least 3 independent experiments. * p ≤ 0.05, ** p ≤ 0.01, *** p ≤ 0.001, **** p ≤ 0.0001

Expression Data

Expression Detail
Antibody Labeling
Phenotype Data

Phenotype Detail
Acknowledgments
This image is the copyrighted work of the attributed author or publisher, and ZFIN has permission only to display this image to its users. Additional permissions should be obtained from the applicable author or publisher of the image. Full text @ Cell Commun. Signal.