
- Title
-
Pioneer neutrophils release chromatin within in vivo swarms
- Authors
- Isles, H.M., Loynes, C.A., Alasmari, S., Kon, F.C., Henry, K.M., Kadochnikova, A., Hales, J., Muir, C.F., Keightley, M.C., Kadirkamanathan, V., Hamilton, N., Lieschke, G.J., Renshaw, S.A., Elks, P.M.
- Source
- Full text @ Elife
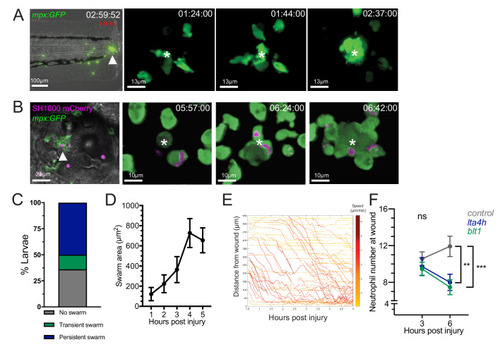
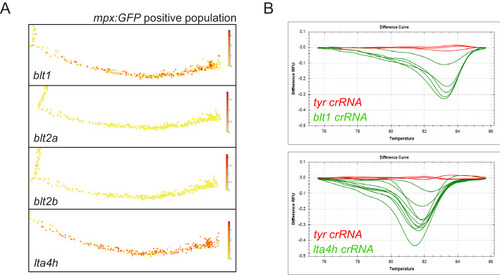
(A) Zebrafish neutrophils swarm at sites of tissue damage. Representative image illustrating neutrophils swarming (arrowhead) at the wound site following tail fin transection in 3dpf mpx:GFP larvae. Image was taken using 20× magnification on a TE2000U inverted microscope (Nikon). Time stamp shown is relative to the start of the imaging period at 30 min post injury and is h:mm:ss. 3D reconstruction time course illustrating neutrophils swarming at the wound site (swarm centre is highlighted by white asterisk). Imaging was performed using a 40× objective spinning disk confocal microscope (Perkin Elmer). Time stamps shown are relative to time post-injury and are in hh:mm:ss. (B) Representative image illustrating neutrophil swarming (arrowhead) in otic vesicle infected with S. aureus (magenta). Time stamps shown are hh:mm relative to time post infection. 3D reconstruction time course illustrating neutrophils swarming (swarm centre is highlighted by white asterisk) within the otic vesicle of 2dpf mpx:GFP larvae injected with 2500 cfu S. aureus SH1000 pMV158mCherry. Imaging was performed using a 20× objective spinning disk confocal microscope. Time stamps shown are hh:mm:ss relative to time post injection. (C) The percentage of tailfin transected larvae that had no swarms, transient swarms, or persistent swarms after 6hpi. Data shown are from n = 14 larvae from five biological replicates (Figure 1—source data 1). (D) Area of neutrophil swarms measured at hourly intervals during the 5 hr imaging period. Error bars shown are mean ± SEM, n = 7 larvae with persistent swarms (Figure 1—source data 2). (E) Distance time plot demonstrating the early recruitment of neutrophils proximal to the wound site (<350 μm) followed by the later recruitment of more distant neutrophils. Tracks are colour coded based on their average speed (µm/min). (F) CRISPR/Cas9-mediated knockdown of LTB4 signalling reduces late neutrophil recruitment. Neutrophil counts at the wound site in control tyr crRNA injected larvae (grey line), lta4h crRNA injected larvae (blue line), and blt1 crRNA injected larvae (green line) at 3 and 6 hpi. Error bars shown are mean ± SEM. Groups were analysed using a two-way ANOVA and adjusted using Sidak’s multi comparison test. **p<0.008 n = 45 accumulated from three biological repeats (Figure 1—source data 3). |
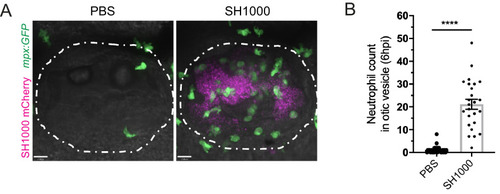
(A) Neutrophils mobilised to the otic vesicle in response to S. aureus at 6 hpi. Otic vesicles of 2 dpf mpx:GFP larvae injected with a PBS vehicle control or 2500 cfu of S. aureus SH1000 pMV158mCherry. Otic vesicles are highlighted by white dashed area. (B) Number of neutrophils mobilised to the otic vesicle at 6 hpi. Error bars shown are mean ± SEM (****p<0.0001 from an unpaired t-test, n = 32 accumulated from three biological repeats) (Figure 1—figure supplement 1—source data 1). |
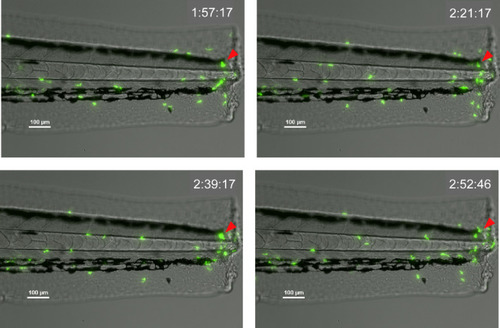
Time course of |
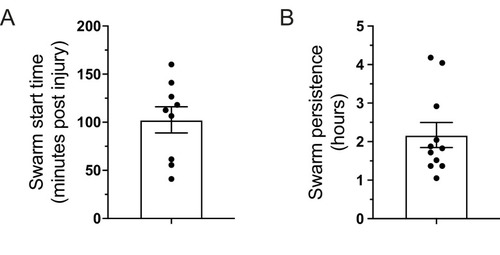
(A) Time (minutes post-injury) in which persistent neutrophil swarms began to develop following tail-fin transection in zebrafish larvae (n = 9 larvae from five imaging runs) (Figure 1—figure supplement 3—source data 1). (B) Persistence time of neutrophil swarms measured during 5 hr imaging period (n = 11 larvae from five imaging runs) (Figure 1—figure supplement 3—source data 2). |
( |
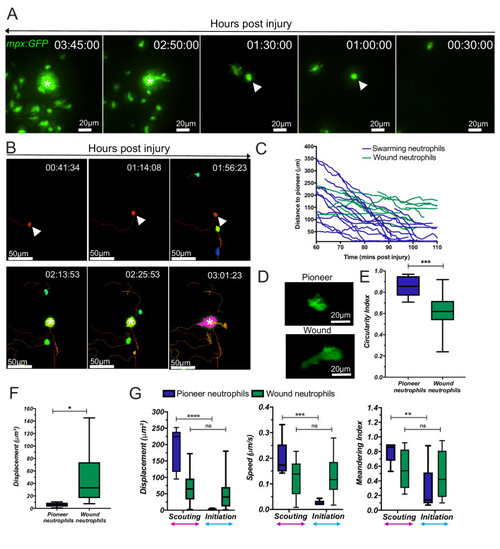
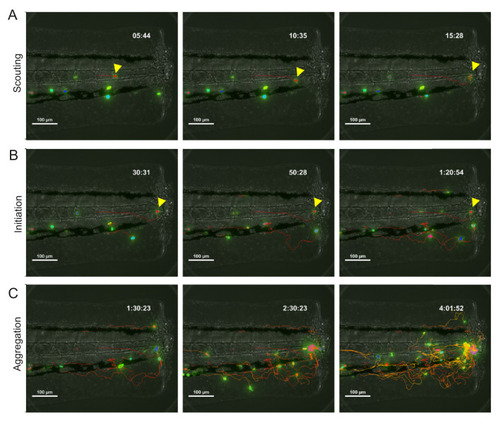
(A) Reverse chronological time lapse sequence of a persistent neutrophil swarm where one individual neutrophil is visible at the swarm centre (asterisk) prior to neutrophil clustering (arrowhead). Time stamps shown are hh:mm:ss relative to injury time. (B) Chronological time lapse sequence of swarming neutrophils. The pioneer is marked with an arrowhead prior to the addition of further neutrophils to the swarm (asterisk). The result of migration is the aggregation of neutrophils to form clusters. (C) Distance-time plot (DTP) of individual cell migration paths of neutrophils at the wound relative to the pioneer neutrophil (blue plots are swarming neutrophils and green plots are nearest neighbour wound neutrophils that do not participate in the swarm). Tracks are relative to pioneer neutrophil position; swarming neutrophils migrate to the pioneer neutrophil, whilst non-swarming neutrophils do not (n = 4 larvae) (Figure 2—source data 1). (D) Representative image of pioneer and non-pioneer neutrophil morphology. Images were taken using a 40X objective lens on a spinning disk confocal microscope (Perkin Elmer). Scale bars are 20 μm. Quantification of pioneer neutrophil migration pattern in the frames preceding swarming. The circularity index (roundness) (E) (Figure 2—source data 2) and displacement (movement) (F) (Figure 2—source data 3) of pioneer neutrophils and wound neutrophils migrating at the wound site in the same time period (n = 5 larvae, unpaired t-test where *p<0.05 and **p<0.01). (G) Neutrophils were tracked from 30 min post injury. Parameters to study the migration patterns of pioneer and wound neutrophils were compared in the scouting and initiation phases. Neutrophil displacement (the linear distance each neutrophil travelled) (Figure 2—source data 4). Neutrophil speed (Figure 2—source data 5). Neutrophil meandering index (the displacement divided by the total length of the neutrophil track) (Figure 2—source data 6). Error bars are mean ± SEM. Groups were analysed using a two-way ANOVA and adjusted using Sidak’s multi comparison test. *p<0.05, **p<0.01, n = 5 larvae. |
( |
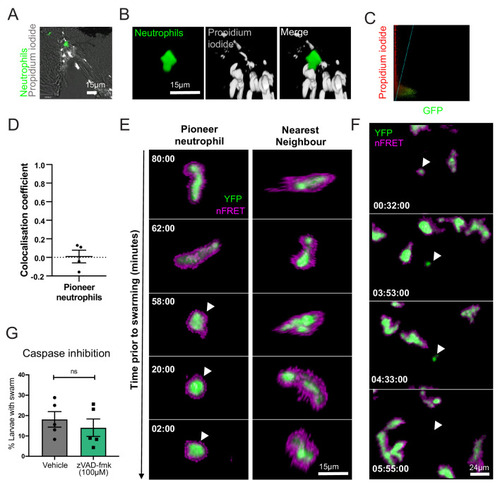
(A–D) Pioneer neutrophils are not propidium iodide positive prior to swarming. (A) Single slice image showing tail fin of injured mpx:GFP larva (bright field), stained with propidium iodide (white). Image shows representative example of pioneer neutrophil at the wound site prior to the swarming response (green). (B) Representative 3D render of pioneer neutrophil during the initiation phase. Left tile shows mpx:GFP pioneer neutrophil, middle tile shows propidium iodide staining, and right tile shows the two merged. (C) Representative colocalisation analysis of pioneer neutrophils, where neutrophil signal (GFP) is on the x axis and propidium iodide signal (mCherry) is on the y axis. (D) Pearson’s colocalisation coefficient for pioneer neutrophils (data shown are mean ± SEM, n = 4 larvae) (Figure 3—source data 1). (E) Pioneer neutrophils are not apoptotic prior to swarming. 3 dpf mpx:FRET larvae were injured, and time lapse imaging was performed from 30 min post-injury for 6 hr. Neutrophil signal from the acceptor (green) and nFRET (magenta) are shown to illustrate neutrophil apoptosis. Representative example of a pioneer neutrophil and its nearest neighbour in the frames preceding neutrophil swarming. The initiation stage is observed 58 min prior to swarming (rounded pioneer neutrophil, arrowhead). nFRET signal is intact at all stages of migration prior to swarming in both the pioneer and nearest-neighbour non-pioneer neutrophil. Time stamps are mm:ss relative to the swarm start time (representative example of n = 6 neutrophils from five larvae). (F) Apoptotic neutrophils do not initiate swarming. Example of neutrophil apoptosis at the wound site demonstrated by loss of FRET signal around 4 hr post-injury (arrowhead), followed by the absence of neutrophil cluster formation in the same tissue region by the end of the imaging period. Time stamp is relative to injury time and is hh:mm:ss. (G) The percentage of larvae with neutrophil swarms at 3 hr post-injury after Caspase inhibition by zVAD-fmk or vehicle control treatment. Data shown are from n = 228 larvae accumulated from five biological replicates (Figure 3—source data 2). Paired data shows each individual experiment using the same batch of larvae over the treatment groups. |
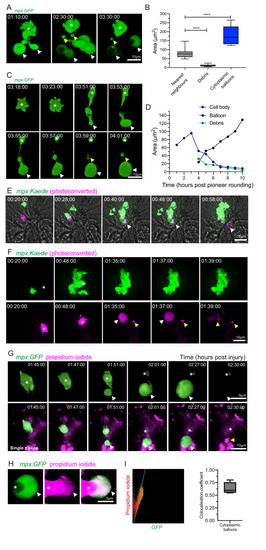
(A) 3D rendered time lapse sequence showing cell fragments around swarming neutrophils (swarm: asterisk, cytoplasmic balloon-like structures: white arrowheads, cell debris: yellow arrowheads). Time stamps are hh:mm:ss relative to injury time. Images were taken using a 40× objective lens on a Perkin-Elmer spinning disk confocal microscope. (B) The area of cellular debris and cytoplasmic vacuoles detected during swarm aggregation were measured alongside three nearest neighbour neutrophils at the wound site (error bars are SEM. Groups were analysed using an ordinary one-way ANOVA with Tukey’s multiple comparison, p<0.0001. N = 5 larvae) (Figure 4—source data 1). (C, D) Timelapse microscopy of catapult cytoplasmic balloon (white arrowhead) release from a single pioneer neutrophil (asterisk), leaving cell debris (yellow arrowhead). A plot of the areas of this event demonstrates that the cytoplasmic balloon grows as the cell body decreases (Figure 4—source data 2). The fluorescence of the debris is lost over the course of the timelapse. (E) A photoconversion approach to study pioneer neutrophils within developing clusters. 3 dpf mpx:Kaede larvae were injured and the neutrophil closest to the wound site was photoconverted from green to red fluorescence at 10 min post-injury. Larvae where the red neutrophil became the swarm-initiating pioneer neutrophil were analysed. Example time lapse of green wild-type swarming neutrophils which cluster around the magenta pioneer neutrophil. A swarm forms around this pioneer (asterisk) while a cytoplasmic balloon is released from the pioneer between 48–58 min post injury (identifiable from the magenta, white arrowhead). Time stamps are hh:mm:ss relative to time post injury. (F) A second example of a photoconverted pioneer neutrophil (asterisk) releasing an extracellular balloon (white arrowhead) and leaving cell debris in and around the swarm (yellow arrowheads). (G) A single confocal Z slice of propidium iodide staining (magenta) demonstrates that a pioneer neutrophil (asterisk), is PI negative until cytoplasmic balloon release (white arrowhead) that becomes PI positive over time (yellow arrowhead) and loses its green fluorescence. (H) A neutrophil (asterisk) cytoplasmic balloon (white arrowhead) becoming positive for propidium iodide. (I) Colocalisation of propidium iodide with neutrophil cytoplasmic fragments (Figure 4—source data 3). |
( |
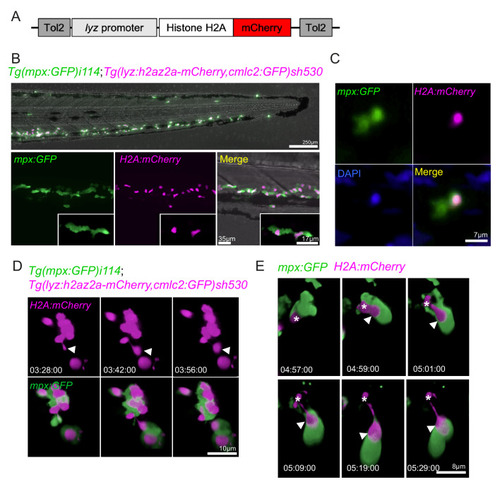
(A) Schematic of the lyz:H2A.mCherry construct made by Gateway cloning, which includes the neutrophil specific promoter (lyz), and the histone H2A gene fused to the fluorescent protein mCherry flanked by Tol2 arms to aid transgenesis. (B, C) Representative image of the stable TgBAC(mpx:GFP)i114;Tg(lyz:H2A.mCherry)sh530 transgenic line. (B) Image shows the caudal haematopoietic tissue of a 3 dpf sh530 larvae, where the H2A mCherry transgene is expressed in neutrophils. (C) 40× confocal image of the transgenic line, showing neutrophil histones labelled by the transgene. (D) Representative example of NET release from swarming neutrophils from six larvae. Time course of Tg(mpx:GFP)i114;Tg(lyz:h2az2a-mCherry,cmlc2:GFP)sh530 larva showing a single neutrophil and histone H2A (white arrows), undergoing NET-like morphological changes where histones are released from the centre of swarms in cytoplasmic vesicles. Time stamps are hh:mm:ss relative to time post injury. (E) A second example timelapse showing that histones are extruded from the nucleus during the cytoplasmic balloon release. |
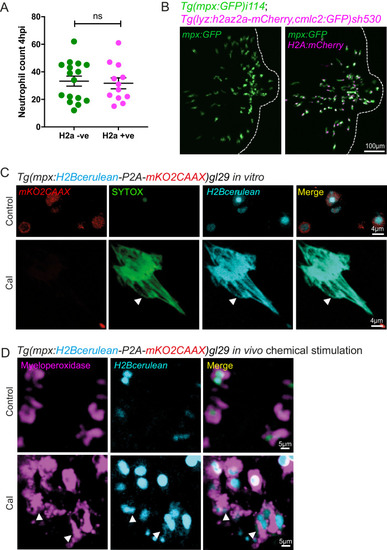
(A) Neutrophil numbers at the tailfin wound at 4 hpi are not affected by the Lyz:H2az2a transgene in the double transgenic Tg(mpx:GFP)i114;Tg(lyz:h2az2a-mCherry,cmcl2:GFP)sh530 (Figure 6—figure supplement 1—source data 1). (B) Example confocal images of the double transgenic Lyz:H2az2a line showing histone labelling of neutrophils at a tailfin wound. (C) Colocalisation of H2B cerulean fluorescence and SYTOX-green stained DNA during in vitro NETosis. Viable unstimulated Tg(mpx:H2Bcerulean-P2A-mKO2CAAX) neutrophils display blue nuclear and red cytoplasmic fluorescence with minimal intracellular SYTOX green DNA staining. NETs released after calcium ionophore (Cal) stimulation show co-localised extracellular H2Bcerulean fluorescence and SYTOX-green stained DNA. In controls, there is a lack of overlap of blue and green signal in some nuclei demonstrating that co-localisation in the NET taken on the same microscopy settings is not an imaging artefact. (D) In vivo stimulation of transgenic H2Bcerulean zebrafish neutrophils following otic vesicle injection of calcium ionophore (Cal) or PBS injection (control). Unstimulated Tg(mpx:H2Bcerulean-P2A-mKO2CAAX) neutrophils display nuclear cerulean fluorescence surrounded by cytoplasmic immunoreactive myeloperoxidase (arrowheads). Following stimulation with Cal regions of dispersed extracellular H2Bcerulean fluorescence overlay with dispersed Myeloperoxidase immunoreactivity (arrowheads). |
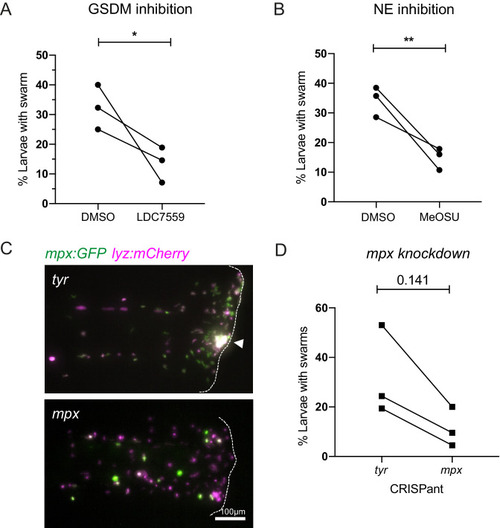
(A) The percentage of larvae with neutrophil swarms at 3 hr post injury after gasdermin inhibitor, LDC7559, or DMSO treatment. Data shown are mean with a minimum of 120 larvae analysed in each group, accumulated from three biological replicates. Joined data represent each individual experiment using larvae from the same zebrafish lay over the two treatment groups (Figure 7—source data 1). (B) The percentage of larvae with neutrophil swarms at 4 hr post injury after neutrophil elastase inhibitor, MeOSu-AAPV-CMK, treatment, or DMSO control. Data shown are mean, with greater than 73 larvae per group over three biological replicates. Joined data represent each individual experiment using larvae from the same zebrafish lay over the two treatment groups (Figure 7—source data 2). (C) Representative fluorescence micrographs of the double transgenic Tg(mpx:GFP);Tg(lyz:nfsβ-mCherry) after myeloperoxidase knockdown using CRISPR-Cas9 with tyrosinase knockdown as a negative control. The myeloperoxidase guide RNA targeted the promoter of mpx, therefore knocking down expression of green mpx:GFP while leaving lyz:mCherry intact. White arrowhead indicates the presence of a swarm at the wound (white dashed line). (D) The percentage of larvae with neutrophil swarms at 4 hr post-injury after mpx knockdown by CRISPR-Cas9 or tyr control. Data shown are mean, with a minimum of 115 larvae analysed in each group, accumulated from three biological replicates (Figure 7—source data 3). Joined data represent each individual experiment using larvae from the same zebrafish lay over the two treatment groups. p-values in (A), (C), and (D) are generated from unpaired t-tests. |
( |