
Figure 1
- ID
- ZDB-FIG-210726-35
- Publication
- Isles et al., 2021 - Pioneer neutrophils release chromatin within in vivo swarms
- Other Figures
- All Figure Page
- Back to All Figure Page
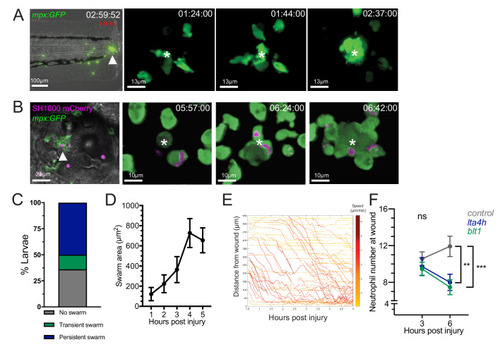
(A) Zebrafish neutrophils swarm at sites of tissue damage. Representative image illustrating neutrophils swarming (arrowhead) at the wound site following tail fin transection in 3dpf mpx:GFP larvae. Image was taken using 20× magnification on a TE2000U inverted microscope (Nikon). Time stamp shown is relative to the start of the imaging period at 30 min post injury and is h:mm:ss. 3D reconstruction time course illustrating neutrophils swarming at the wound site (swarm centre is highlighted by white asterisk). Imaging was performed using a 40× objective spinning disk confocal microscope (Perkin Elmer). Time stamps shown are relative to time post-injury and are in hh:mm:ss. (B) Representative image illustrating neutrophil swarming (arrowhead) in otic vesicle infected with S. aureus (magenta). Time stamps shown are hh:mm relative to time post infection. 3D reconstruction time course illustrating neutrophils swarming (swarm centre is highlighted by white asterisk) within the otic vesicle of 2dpf mpx:GFP larvae injected with 2500 cfu S. aureus SH1000 pMV158mCherry. Imaging was performed using a 20× objective spinning disk confocal microscope. Time stamps shown are hh:mm:ss relative to time post injection. (C) The percentage of tailfin transected larvae that had no swarms, transient swarms, or persistent swarms after 6hpi. Data shown are from n = 14 larvae from five biological replicates (Figure 1—source data 1). (D) Area of neutrophil swarms measured at hourly intervals during the 5 hr imaging period. Error bars shown are mean ± SEM, n = 7 larvae with persistent swarms (Figure 1—source data 2). (E) Distance time plot demonstrating the early recruitment of neutrophils proximal to the wound site (<350 μm) followed by the later recruitment of more distant neutrophils. Tracks are colour coded based on their average speed (µm/min). (F) CRISPR/Cas9-mediated knockdown of LTB4 signalling reduces late neutrophil recruitment. Neutrophil counts at the wound site in control tyr crRNA injected larvae (grey line), lta4h crRNA injected larvae (blue line), and blt1 crRNA injected larvae (green line) at 3 and 6 hpi. Error bars shown are mean ± SEM. Groups were analysed using a two-way ANOVA and adjusted using Sidak’s multi comparison test. **p<0.008 n = 45 accumulated from three biological repeats (Figure 1—source data 3). |