
Figure 2
- ID
- ZDB-FIG-210726-41
- Publication
- Isles et al., 2021 - Pioneer neutrophils release chromatin within in vivo swarms
- Other Figures
- All Figure Page
- Back to All Figure Page
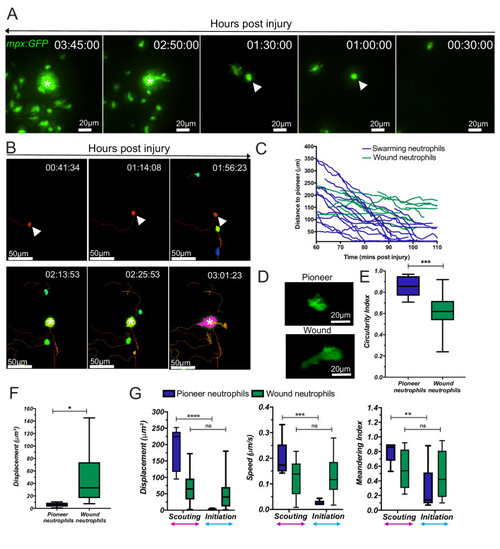
(A) Reverse chronological time lapse sequence of a persistent neutrophil swarm where one individual neutrophil is visible at the swarm centre (asterisk) prior to neutrophil clustering (arrowhead). Time stamps shown are hh:mm:ss relative to injury time. (B) Chronological time lapse sequence of swarming neutrophils. The pioneer is marked with an arrowhead prior to the addition of further neutrophils to the swarm (asterisk). The result of migration is the aggregation of neutrophils to form clusters. (C) Distance-time plot (DTP) of individual cell migration paths of neutrophils at the wound relative to the pioneer neutrophil (blue plots are swarming neutrophils and green plots are nearest neighbour wound neutrophils that do not participate in the swarm). Tracks are relative to pioneer neutrophil position; swarming neutrophils migrate to the pioneer neutrophil, whilst non-swarming neutrophils do not (n = 4 larvae) (Figure 2—source data 1). (D) Representative image of pioneer and non-pioneer neutrophil morphology. Images were taken using a 40X objective lens on a spinning disk confocal microscope (Perkin Elmer). Scale bars are 20 μm. Quantification of pioneer neutrophil migration pattern in the frames preceding swarming. The circularity index (roundness) (E) (Figure 2—source data 2) and displacement (movement) (F) (Figure 2—source data 3) of pioneer neutrophils and wound neutrophils migrating at the wound site in the same time period (n = 5 larvae, unpaired t-test where *p<0.05 and **p<0.01). (G) Neutrophils were tracked from 30 min post injury. Parameters to study the migration patterns of pioneer and wound neutrophils were compared in the scouting and initiation phases. Neutrophil displacement (the linear distance each neutrophil travelled) (Figure 2—source data 4). Neutrophil speed (Figure 2—source data 5). Neutrophil meandering index (the displacement divided by the total length of the neutrophil track) (Figure 2—source data 6). Error bars are mean ± SEM. Groups were analysed using a two-way ANOVA and adjusted using Sidak’s multi comparison test. *p<0.05, **p<0.01, n = 5 larvae. |