
|
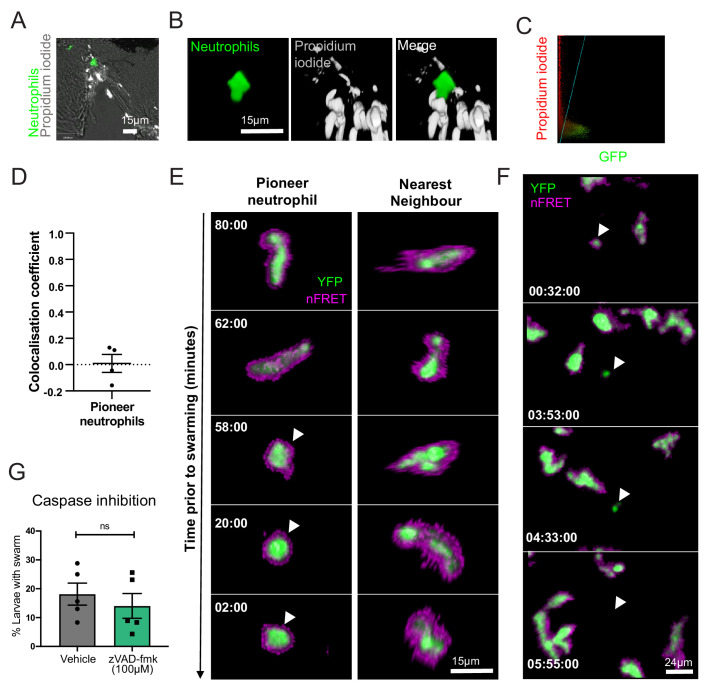
Figure 3 (A–D) Pioneer neutrophils are not propidium iodide positive prior to swarming. (A) Single slice image showing tail fin of injured mpx:GFP larva (bright field), stained with propidium iodide (white). Image shows representative example of pioneer neutrophil at the wound site prior to the swarming response (green). (B) Representative 3D render of pioneer neutrophil during the initiation phase. Left tile shows mpx:GFP pioneer neutrophil, middle tile shows propidium iodide staining, and right tile shows the two merged. (C) Representative colocalisation analysis of pioneer neutrophils, where neutrophil signal (GFP) is on the x axis and propidium iodide signal (mCherry) is on the y axis. (D) Pearson’s colocalisation coefficient for pioneer neutrophils (data shown are mean ± SEM, n = 4 larvae) (Figure 3—source data 1). (E) Pioneer neutrophils are not apoptotic prior to swarming. 3 dpf mpx:FRET larvae were injured, and time lapse imaging was performed from 30 min post-injury for 6 hr. Neutrophil signal from the acceptor (green) and nFRET (magenta) are shown to illustrate neutrophil apoptosis. Representative example of a pioneer neutrophil and its nearest neighbour in the frames preceding neutrophil swarming. The initiation stage is observed 58 min prior to swarming (rounded pioneer neutrophil, arrowhead). nFRET signal is intact at all stages of migration prior to swarming in both the pioneer and nearest-neighbour non-pioneer neutrophil. Time stamps are mm:ss relative to the swarm start time (representative example of n = 6 neutrophils from five larvae). (F) Apoptotic neutrophils do not initiate swarming. Example of neutrophil apoptosis at the wound site demonstrated by loss of FRET signal around 4 hr post-injury (arrowhead), followed by the absence of neutrophil cluster formation in the same tissue region by the end of the imaging period. Time stamp is relative to injury time and is hh:mm:ss. (G) The percentage of larvae with neutrophil swarms at 3 hr post-injury after Caspase inhibition by zVAD-fmk or vehicle control treatment. Data shown are from n = 228 larvae accumulated from five biological replicates (Figure 3—source data 2). Paired data shows each individual experiment using the same batch of larvae over the treatment groups.