
|
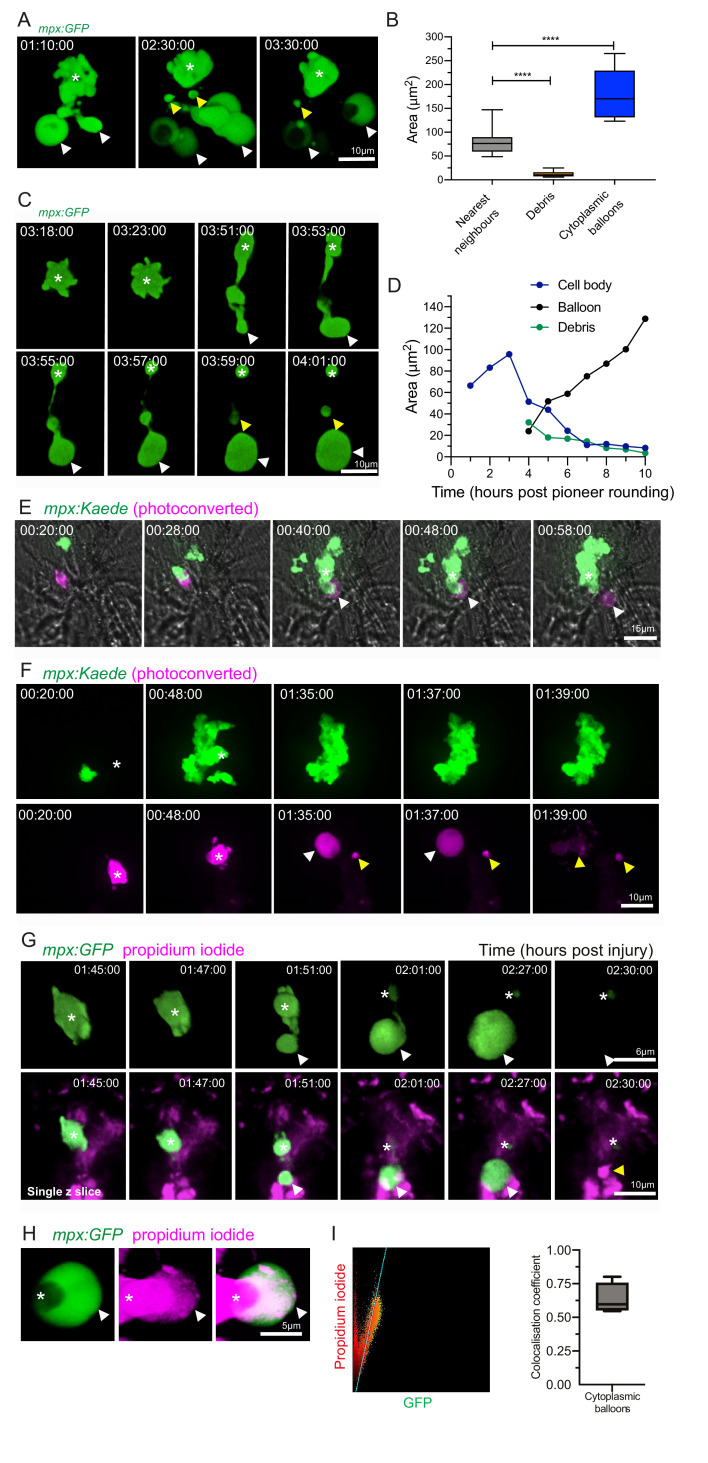
Figure 4 (A) 3D rendered time lapse sequence showing cell fragments around swarming neutrophils (swarm: asterisk, cytoplasmic balloon-like structures: white arrowheads, cell debris: yellow arrowheads). Time stamps are hh:mm:ss relative to injury time. Images were taken using a 40× objective lens on a Perkin-Elmer spinning disk confocal microscope. (B) The area of cellular debris and cytoplasmic vacuoles detected during swarm aggregation were measured alongside three nearest neighbour neutrophils at the wound site (error bars are SEM. Groups were analysed using an ordinary one-way ANOVA with Tukey’s multiple comparison, p<0.0001. N = 5 larvae) (Figure 4—source data 1). (C, D) Timelapse microscopy of catapult cytoplasmic balloon (white arrowhead) release from a single pioneer neutrophil (asterisk), leaving cell debris (yellow arrowhead). A plot of the areas of this event demonstrates that the cytoplasmic balloon grows as the cell body decreases (Figure 4—source data 2). The fluorescence of the debris is lost over the course of the timelapse. (E) A photoconversion approach to study pioneer neutrophils within developing clusters. 3 dpf mpx:Kaede larvae were injured and the neutrophil closest to the wound site was photoconverted from green to red fluorescence at 10 min post-injury. Larvae where the red neutrophil became the swarm-initiating pioneer neutrophil were analysed. Example time lapse of green wild-type swarming neutrophils which cluster around the magenta pioneer neutrophil. A swarm forms around this pioneer (asterisk) while a cytoplasmic balloon is released from the pioneer between 48–58 min post injury (identifiable from the magenta, white arrowhead). Time stamps are hh:mm:ss relative to time post injury. (F) A second example of a photoconverted pioneer neutrophil (asterisk) releasing an extracellular balloon (white arrowhead) and leaving cell debris in and around the swarm (yellow arrowheads). (G) A single confocal Z slice of propidium iodide staining (magenta) demonstrates that a pioneer neutrophil (asterisk), is PI negative until cytoplasmic balloon release (white arrowhead) that becomes PI positive over time (yellow arrowhead) and loses its green fluorescence. (H) A neutrophil (asterisk) cytoplasmic balloon (white arrowhead) becoming positive for propidium iodide. (I) Colocalisation of propidium iodide with neutrophil cytoplasmic fragments (Figure 4—source data 3).