
- Title
-
Cardiac toxicity assessment of pendimethalin in zebrafish embryos
- Authors
- Meng, Y., Zhong, K., Chen, S., Huang, Y., Wei, Y., Wu, J., Liu, J., Xu, Z., Guo, J., Liu, F., Lu, H.
- Source
- Full text @ Ecotoxicol. Environ. Saf.
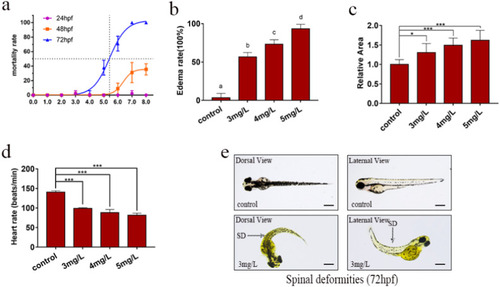
The toxicity of PND on zebrafish embryo development was studied. (a) Effects of PND on embryo mortality rate of zebrafish. (b) The effect of PND exposure to 72 hpf on zebrafish embryo edema rate. (c) The relative edema area of zebrafish embryos induced by PND. (d) Exposure to PND decreased the heart rate of zebrafish embryos. (e) Exposure to different concentrations of PND reduced the body length of zebrafish embryos. The values are expressed as the mean ± standard deviation of three independent experiments. *p < 0.05, **p < 0.01, ***p < 0.001. Different letters above bars mean significant differences between different treatments at p < 0.05 (Means ± S.E.). |
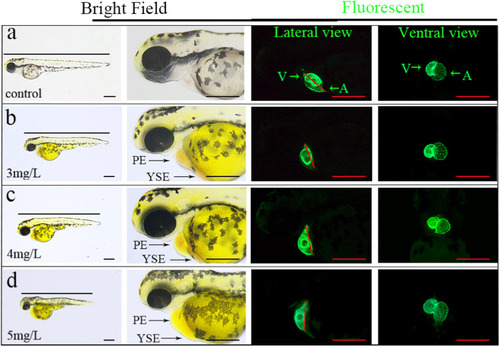
Heart morphology of zebrafish embryos exposed to PND for 72 h. With the increase of exposure concentration, pericardial and yolk sac edema increased (Bright Field), the SV-BA distance was increased (Fluorescent, Lateral view), and cardiac looped incomplete (Fluorescent, Ventral view). Green arrow indicates the atria and ventricles, Red line represents the SV-BA distance. PE, pericardial edema; YSE, yolk sac edema; SV-BA, sinus venous and bulbus arteriosus; A, atrium; V, ventricle; Scale = 350 µm. PHENOTYPE:
|
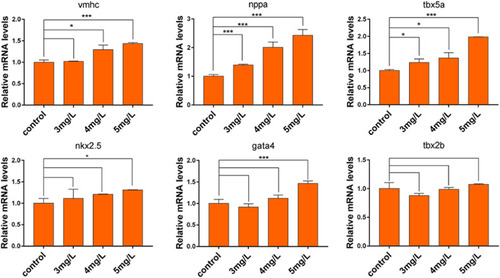
PND changed the transcription level of genes related to cardiac development. The values are expressed as the mean ± standard deviation of three independent experiments. *p < 0.05, **p < 0.01,***p < 0.001. EXPRESSION / LABELING:
PHENOTYPE:
|

PND induced oxidative stress in zebrafish larvae. (a-d) different concentrations of PND showed the distribution of reactive oxygen species in zebrafish larvae. (e) The relative fluorescence intensity of ROS. (f) The relative content of MDA. (g-h) The activities of SOD and CAT were determined. The values are expressed as the mean ± standard deviation of three independent experiments (n = 3). *p < 0.05, **p < 0.01, ***p < 0.001; Scale = 350 µm. PHENOTYPE:
|
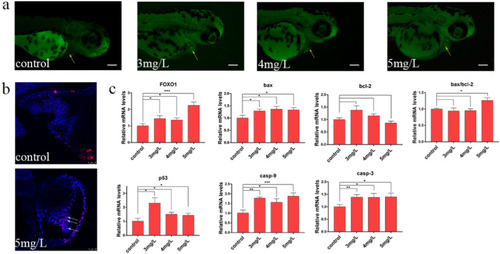
PND induced apoptosis of zebrafish cells. (a) AO staining. The green highlights represent apoptotic cells; Scale = 350 µm. (b) Representative images of TUNEL-stained embryos showing apoptotic cells (white arrow). (c) After exposure to PND, the transcription level of apoptosis related genes was changed. The values are expressed as the mean ± standard deviation of three independent experiments (n = 3). *p < 0.05, **p < 0.01, ***p < 0.001. EXPRESSION / LABELING:
PHENOTYPE:
|
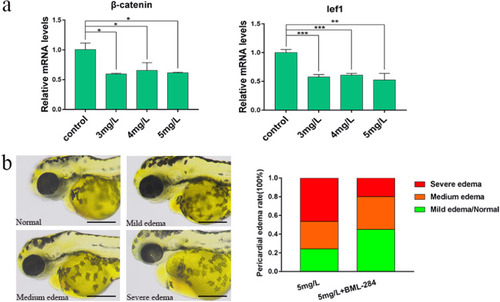
PND causes heart toxicity by the wnt signal. (a)The changes of transcription level of Wnt signal related genes were examined after exposure to PND. (b) BML-284 was added to rescue phenotypic response to PND exposure. The values are expressed as the mean ± standard deviation of three independent experiments (n = 3). *p < 0.05, **p < 0.01, ***p < 0.001. EXPRESSION / LABELING:
PHENOTYPE:
|
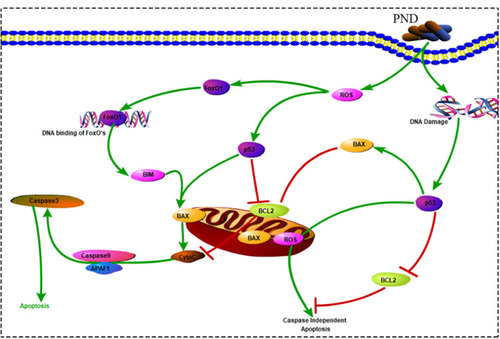
PND induced apoptosis may be mediated by ROS mediated P53/FoxO1 pathway. |