
- Title
-
In Vivo Behavior of the Antibacterial Peptide Cyclo[RRRWFW], Explored Using a 3-Hydroxychromone-Derived Fluorescent Amino Acid
- Authors
- Afonin, S., Koniev, S., Préau, L., Takamiya, M., Strizhak, A.V., Babii, O., Hrebonkin, A., Pivovarenko, V.G., Dathe, M., le Noble, F., Rastegar, S., Strähle, U., Ulrich, A.S., Komarov, I.V.
- Source
- Full text @ Front Chem

(A) Structure of the antimicrobial peptide cWFW with colour-highlighted aromatic residues that were individually substituted by the fluorescent label in this study; (B) the fluorescent amino acid FHC used as the label (framed and colored) along with potential alternatives, i.e., reported fluorescent amino acids with the excitation wavelengths higher than 360 nm. Compounds are designated according to original reports, excitation wavelengths (“Ex.”) are stated; (C) excited-state intramolecular proton transfer (ESIPT)-mediated fluorescence, causing dual emission and environmental sensitivity of the chromophore in 3-hydroxychromone-containing labels. N (N*) and T (T*) represent normal and tautomeric forms, respectively, in the ground (excited) state; BPT denotes back proton transfer in the ground state. |
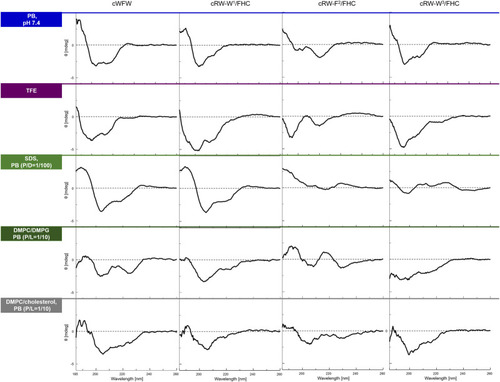
CD spectra of the peptides in various environments (top to bottom traces): in 10 mM phosphate buffer, pH 7,4, in 2,2,2-trifluoroethanol (TFE), in 10 mM sodium dodecyl sulphate (SDS) micelles at a peptide/detergent ratio (P/D) of 1/100, in the presence of large unilamellar vesicles (LUVs) modeling an “animal” (DMPC/cholesterol, 4/1) or a “bacterial” (DMPC/DMPG, 1/1) plasma membrane in terms of the lipid composition. The spectra were acquired from fresh 100 µM (or 200 µM for LUVs) peptide solutions at 25°C or 35°C (LUVs). P/L designates peptide/lipid ratio. |
|

Fluorescence spectra (not normalized) from 8 µM solutions of the FHC-labeled cWFW analogues in H2O and DMF under different excitation wavelengths (indicated as “Ex 370 nm” and “Ex 405 nm”). |
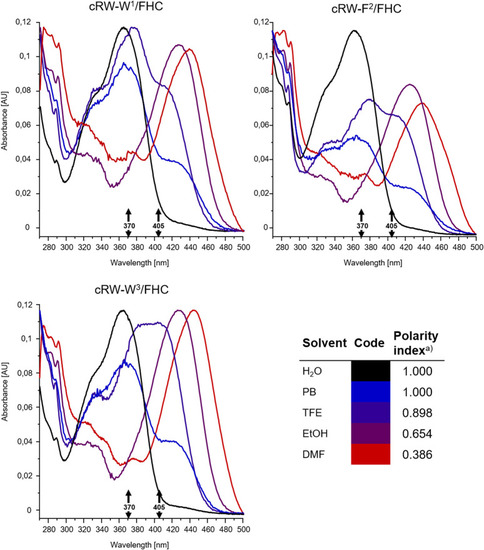
Intensity-normalized absorbance spectra from 8 µM solutions of the FHC-labelled cWFW analogues in solvents of different polarities, colored according to the polarity index ( |

Orthogonal projections of the two energetically preferred conformations |
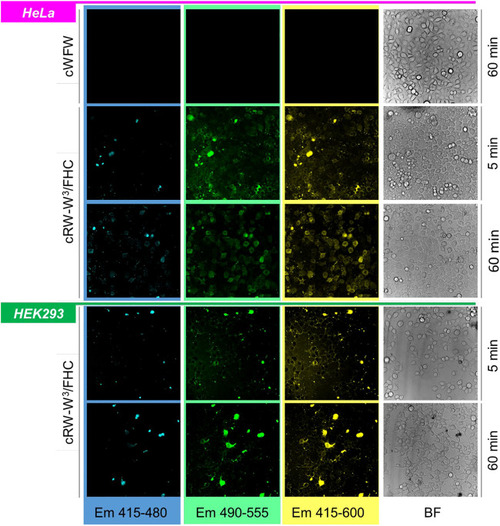
Band-filtered confocal fluorescence images of adherent HeLa and HEK293 cell cultures incubated with 30 µM cRW-W3/FHC for 5 and 60 min (indicated). Spectral ranges for collecting emission data are shown at the bottom of the image stacks; BF = bright-field images. |
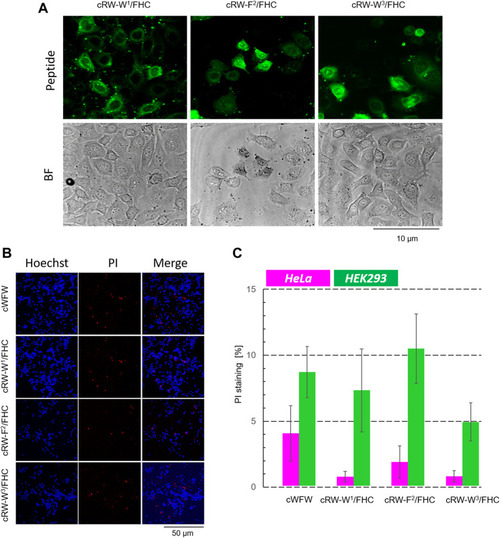
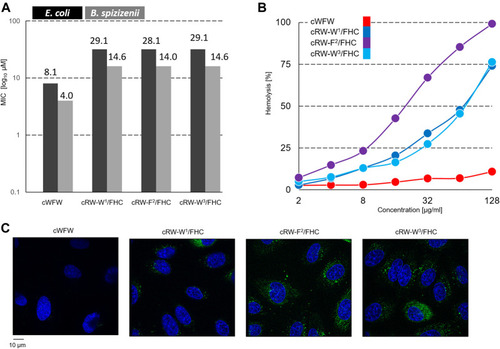
Cytotoxicity evaluation of cWFW and its fluorescent analogues by fluorescence microscopy. |
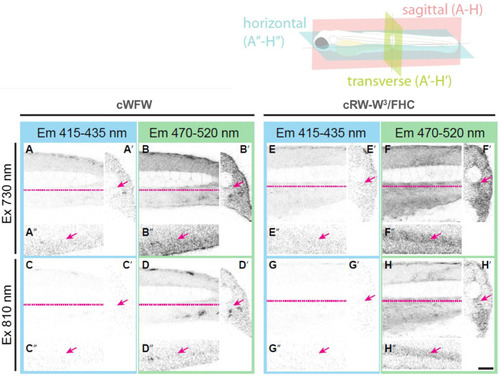
Orthogonal section views from four dpf zebrafish embryos injected with either cWFW in PBS |