IMAGE

FIGURE 3

ID
ZDB-IMAGE-210717-23
Source
Figures for Afonin et al., 2021
Image
Figure Caption

FIGURE 3

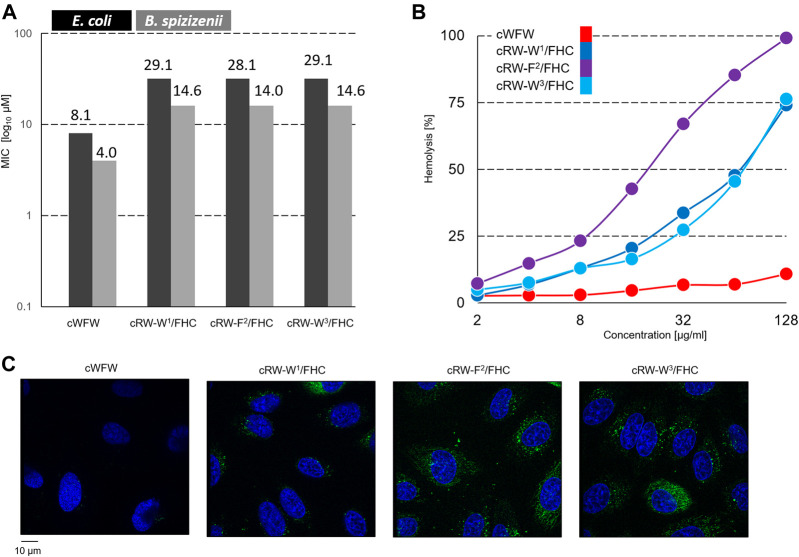
(A) Planktonic bacterial growth inhibition according to a broth microdilution assay. Numbers depict µM values calculated from µg/ml dilutions; (B) concentration-dependent hemoglobin release from human erythrocyte suspension; and (C) fluorescence microscopy observation of Hoechst 33342 (blue color)-co-stained Hela cells after 1 h of incubation with 30 µM FHC-labelled cWFW analogues (green color). Images are 105 × 114 µm.

Acknowledgments
This image is the copyrighted work of the attributed author or publisher, and ZFIN has permission only to display this image to its users. Additional permissions should be obtained from the applicable author or publisher of the image. Full text @ Front Chem