
- Title
-
Host-emitted amino acid cues regulate bacterial chemokinesis to enhance colonization
- Authors
- Robinson, C.D., Sweeney, E.G., Ngo, J., Ma, E., Perkins, A., Smith, T.J., Fernandez, N.L., Waters, C.M., Remington, S.J., Bohannan, B.J.M., Guillemin, K.
- Source
- Full text @ Cell Host Microbe
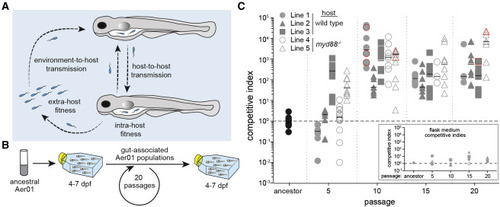
Figure 1. Rapid and reproducible adaptation of Aer01 serially passaged in populations of larval zebrafish (A) Schematic of the Aer01 colonization cycle within a host population and potential adaptive strategies. (B) Evolution experiment passaging scheme (dpf, days post-fertilization). (C) Competitive indices (CI) of Aer01 ancestor and evolved isolates, competed with an ancestral reference strain (see also Figure S1A). Each data point represents the CI from an individual fish. Lines 1–3 (gray filled symbols) were evolved in WT hosts; lines 4 and 5 (gray open symbols) were evolved in myd88−/− hosts. Points outlined in red represent a lower bound for the actual CI (see STAR Methods). Black bar, median. n ≥ 4 fish/condition, one experimental replicate. Dotted line indicates CI of 1 (i.e., no competitive advantage). Inset graph presents CI data for isolates in the flask medium (a single point for each flask); y axis and symbols match the main graph. See also Figure S1. |
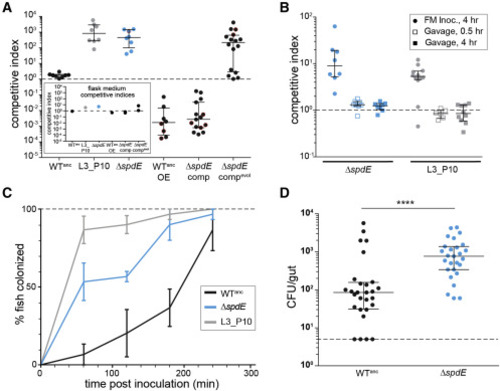
Figure 2. Loss of spdE enables rapid immigration into hosts and fish-to-fish transmission (A) Competitive indices (CI) of ancestral Aer01 (WTanc), an evolved isolate (L3_P10), ΔspdE, the WT overexpressing spdE (WTanc_OE), ΔspdE complemented with WT copy of spdE (ΔspdE_comp), and ΔspdE complemented with an evolved mutant allele (ΔspdE_compevol). All strains were competed against a WT reference strain (see Figure S1A). Points outlined in red represent a lower or upper bound for the actual CI (see STAR Methods). Dotted line indicates CI of 1 (i.e., no competitive advantage). n ≥ 8 fish/condition, one experimental replicate. Inset graph presents CI data for Aer01 mutants in the flask medium (a single point for each flask); y axis and symbols match the main graph. (B) Competitive indices of ΔspdE and L3_P10 evolved isolate are dependent on mode of inoculation (flask medium [FM inoc.] versus gavage). Dotted line indicates CI of 1 (i.e., no competitive advantage). n ≥ 6 fish/condition, one experimental replicate. (C) Immigration rates of ancestral Aer01, ΔspdE, and the L3_P10 mono-associated into larval fish (see STAR Methods and Figure S3A) (n = 3 experimental replicates per time point). Means (± SEM) are plotted. (D) Fish-to-fish transmission of ancestral Aer01 (WTanc) and ΔspdE. Mono-associated “donor” fish were added to a flasks of GF “recipient” fish for 15 h, then abundances of Aer01 in all fish were determined. n ≥ 27 fish/condition, two experimental replicates. p value < 0.0001, two-tailed Mann-Whitney test. CFU/gut, colony-forming units per gut. Median and interquartile ranges are plotted in (A, B, and D). See also Figure S2. |
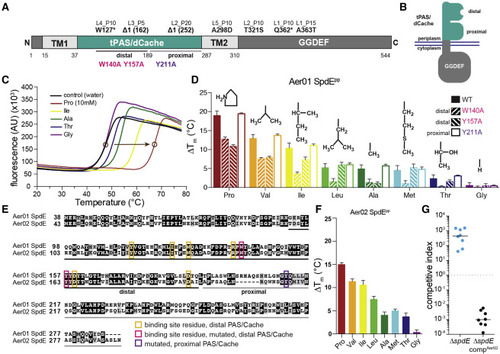
Figure 3. SpdE protein architecture and ligand binding (A) SpdE protein architecture. Aer01 SpdE residue numbers are below the bar. Specific mutations in the evolved isolates are labeled at their approximate locations (see Table S1). (B) Schematic of SpdE integrated into the inner cell membrane. (C) Representative thermal shift assay curves of the tPAS/dCache region of Aer01 SpdE (SpdEpp). Circles show approximate melting temperatures (Tm) for control and proline. (D) Thermal shift results (L-amino acids relative to control) of Aer01 SpdEpp WT and three point mutants. Amino acid side chains (R group are drawn above the bars. n ≥ 6 technical replicates, 2–3 experimental replicates, bars represent mean + SD. (E) Alignment of Aer01 and Aer02 SpdE amino acid sequences (tPAS/dCache domains only). Gray-highlighted residues, similar; black, identical; white, dissimilar. Pink and yellow boxes indicate putative binding site residues in the distal PAS/Cache domain and pink and purple boxes are residues mutated to assess ligand-binding location, see (D). (F) Thermal shift assay results of Aer02 SpdEpp. n ≥ 6 technical replicates, 2–3 experimental replicates, bars represent mean + SD. (G) Competitive index data showing that Aer02 spdE can functionally complement Aer01 spdE in Aer01. See also Figures S3 and S4. |
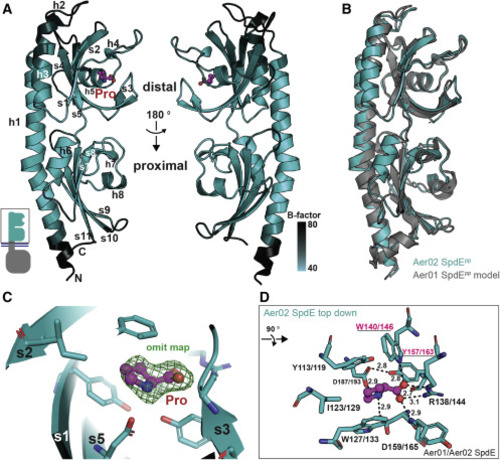
Figure 4. SpdE tPAS/dCache crystal structure provides insight into ligand binding (A) Ribbon diagram of Aer02 SpdEpp structure with proline bound (pink). Secondary elements are labeled (h, helix; s, beta strand). Shading based on atomic mobility (B-factors, black, more flexible; lighter teal, less flexible). PDB: 7K5N. (B) I-TASSER model of Aer01 SpdEpp structure (gray) superimposed onto Aer02 SpdEpp crystal structure (teal). (C) Detail of the distal PAS/Cache proline binding pocket showing Fo-Fc “omit” electron density for proline as green mesh (contour level, 2.0 sigma). (D) The eight distal SpdE residues and one main chain NH ligating bound proline are shown as teal sticks, bound proline in pink. Aer01/02 sequence numbering shows identically conserved binding site residues. Underlined residues indicate targets of site-directed mutagenesis, see Figure 3D. Hydrogen bonds to proline are shown, distances in angstroms. For (A), (C), and (D): red, oxygen; blue, nitrogen. |
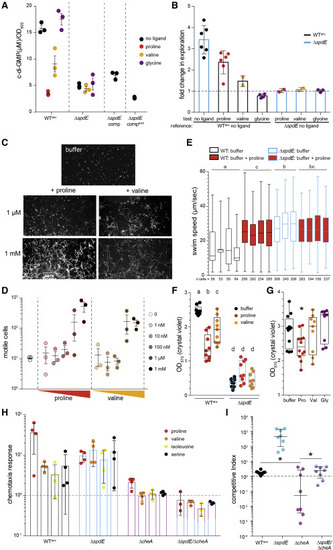
Figure 5. SpdE regulates Aer01 chemokinesis and biofilm formation via modulation of c-di-GMP (A) Intracellular quantification of c-di-GMP in the absence or presence (1 mM) of SpdE ligands. WTanc, ancestral Aer01; ΔsdE, knockout strain; ΔspdE_comp and ΔspdE_compevol, ΔspdE complemented with a WT copy of spdE or an evolved mutant allele, respectively. n = 3 independent cultures. (B) Population-level Aer01 motility for WTanc and ΔspdE determined by exploration assay (see Figure S7); “reference” strain/condition specified at bottom. n = 2–6 experimental replicates. Bars are mean ± SD. Dotted line represents fold change of 1 (i.e., no difference in motility). Blue outlined bars, ΔspdE; black outlined bars, WTanc. (C) Representative mass projection plots of movies of fluorescently tagged WTanc to visualize motility. White trails are “swimming tracks” of motile cells. Mass projections of all movies shown in Figure S8. (D) Quantification of number of motile cells from all movies (see Figure S8) of WTanc across a range of ligand. Mean ± SEM is plotted. n = 3 movies/condition. (E) Swim velocities of individual Aer01 motile cells (WTanc and ΔspdE) incubated ± 1 mM proline. Each box represents data from a single movie (n = 3–4 movies per strain/condition; number of motile cells/movie indicated below each plot); black outline, WTanc; blue outline, ΔspdE; red fill, proline condition. Statistical groups (each set of box plots for a strain/condition) were compared by combining averages for each group (ANOVA, Tukey’s range test). (F) Quantification of biofilm formation for WTanc and ΔspdE Aer01 ± ligand. Black outline, WTanc; blue outline, ΔspdE. ANOVA, Tukey’s range test. n = 9, 3 experimental replicates. (G) SpdE ligand impact on biofilm dispersal. Statistical significance (compared with buffer) determined by unpaired, two-tailed t test, ∗p < 0.05. Pro, proline; Val, valine; Gly, glycine. n = 9–12; 3–4 experimental replicates. (H) Chemotaxis response of Aer01 strains to amino acids. All amino acid responses compared with buffer control. Each data point represents an independent experiment. Bars represent mean ± SD. Dotted line represents fold change of 1 (i.e., no difference in chemotaxis); n = 3–4 experimental replicates. (I) Competitive indices of WTanc, ΔspdE, ΔcheA, and ΔspdE/ΔcheA strains when competed in larval fish against a WT reference strain (see Figure S1A). Dotted line indicates CI of 1 (i.e., no competitive advantage). n ≥ 8 fish/condition, one experimental replicate. Data for WTanc and ΔspdE are the same as those plotted in Figure 2A. ∗p < 0.05, two-tailed t test performed on log-transformed CI data. For box and whisker plots in (E), (F), and (G), boxes represent median and interquartile ranges; whiskers represent the min and max. See also Figures S5 and S6. |

Figure 6. Aer01 host colonization is modulated by SpdE ligands and mediated by the microbiota (A) Competitive indices of ΔspdE (competed against the WT reference strain) ± added amino acids in the system. Dotted line indicates CI of 1 (i.e., no competitive advantage). n ≥ 8 fish/condition, 1–3 experimental replicates. Median and interquartile ranges are plotted. Statistical significance compared with no amino acid control group determined by Kruskal-Wallis with Dunn’s multiple comparisons, ∗∗∗∗p < 0.0001; ∗∗p < 0.01; ∗p < 0.05; ns, not significant. (B) Determination of the effect of SpdE ligand (Val, valine; 1 mM) on immigration rate of WTanc (see Figure S3A). The WTanc (no Val) and ΔspdE data are the same as plotted in Figure 2C; included for reference. n = 2–3 experimental replicates per condition. Means (± SEM) are plotted. (C) Competitive indices of ΔspdE (competed against the WT reference strain) in GF and CV larval zebrafish. Median and interquartile ranges are plotted. ∗∗∗∗p < 0.0001, two-tailed Mann-Whitney test. n ≥ 28 (GF) or 52 (CV) fish combined from 3 (GF) or 6 (CV) independent experiments. (D) Motility of WTanc determined by exploration assay (see Figure S7) comparing motility in CV fish-conditioned flask media (FC-FM) to GF FC-FM. Each data point represents an independent experiment. n = 8 independent experiments using media collected from different flasks of GF and CV larval zebrafish. Bar, mean (± SD). Dotted line represents fold change of 1 (i.e., no difference). ∗p < 0.05; one-sample t test, statistically different than 1. (E) Quantification of biofilm formation for WTanc in GF and CV FC-FM. Dotted lines connect data comparing GF and CV FC-FM collected on the same day from fish from the same egg clutch. n = 6 experimental replicates; each data point represents an independent experiment using CV or GF FC-FM collected from a different fish flask. ∗p < 0.05, paired t test. (F) Histogram of the number of predicted proteins in the zebrafish genome, binned according to % proline. Pro, proline. (G) Quantification of WTanc (black outlined bars) and ΔspdE (blue outlined bars) motility (exploration assay) in supernatant from collagenase-digested larval zebrafish (Col + F). Supernatant from untreated fish (Fish), untreated fish spiked with proline (F + Pro), and a collagenase only (Col) are included as references. Each data point represents an independent experiment; “reference” strain/condition indicated on bottom. n = 2 experimental replicates. Bar, mean. Dotted line represents fold change of 1 (i.e., no difference). See also Figure S7. |
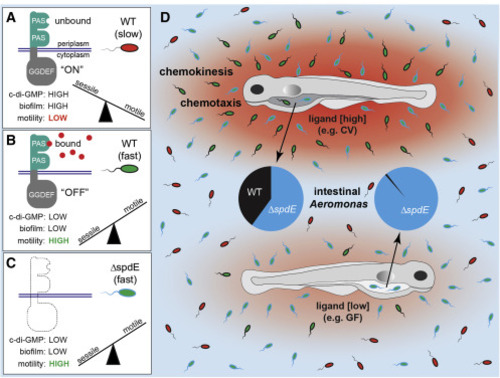
Figure 7. A model for Aer01’s SpdE-dependent motility and host colonization (A) Unbound SpdE stimulates c-di-GMP production (“ON”). High intracellular c-di-GMP levels promote a sessile lifestyle and inhibit motility. (B) Bound SpdE signals to turn “OFF” c-di-GMP production, switching Aer01 from sessile to highly motile. (C) Loss of SpdE (e.g., ΔspdE) functionally recapitulates the “OFF” state, with low levels of c-di-GMP and a highly motile lifestyle. (D) Hosts can be sources of varying amounts of SpdE ligands (red gradients) depending on microbiome composition. Aer01 can sense and respond to these amino acid gradients, via chemokinesis and chemotaxis, to modulate immigration into hosts emitting high amounts of ligand (CV fish) versus lower amounts of ligand (GF fish). |