
|
Fig. 6
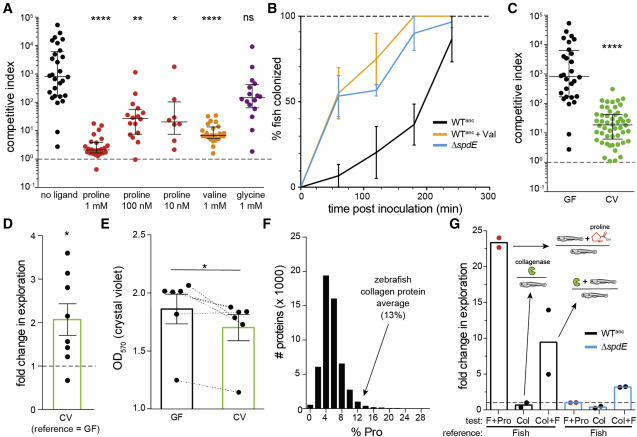
Figure 6. Aer01 host colonization is modulated by SpdE ligands and mediated by the microbiota (A) Competitive indices of ΔspdE (competed against the WT reference strain) ± added amino acids in the system. Dotted line indicates CI of 1 (i.e., no competitive advantage). n ≥ 8 fish/condition, 1–3 experimental replicates. Median and interquartile ranges are plotted. Statistical significance compared with no amino acid control group determined by Kruskal-Wallis with Dunn’s multiple comparisons, ∗∗∗∗p < 0.0001; ∗∗p < 0.01; ∗p < 0.05; ns, not significant. (B) Determination of the effect of SpdE ligand (Val, valine; 1 mM) on immigration rate of WTanc (see Figure S3A). The WTanc (no Val) and ΔspdE data are the same as plotted in Figure 2C; included for reference. n = 2–3 experimental replicates per condition. Means (± SEM) are plotted. (C) Competitive indices of ΔspdE (competed against the WT reference strain) in GF and CV larval zebrafish. Median and interquartile ranges are plotted. ∗∗∗∗p < 0.0001, two-tailed Mann-Whitney test. n ≥ 28 (GF) or 52 (CV) fish combined from 3 (GF) or 6 (CV) independent experiments. (D) Motility of WTanc determined by exploration assay (see Figure S7) comparing motility in CV fish-conditioned flask media (FC-FM) to GF FC-FM. Each data point represents an independent experiment. n = 8 independent experiments using media collected from different flasks of GF and CV larval zebrafish. Bar, mean (± SD). Dotted line represents fold change of 1 (i.e., no difference). ∗p < 0.05; one-sample t test, statistically different than 1. (E) Quantification of biofilm formation for WTanc in GF and CV FC-FM. Dotted lines connect data comparing GF and CV FC-FM collected on the same day from fish from the same egg clutch. n = 6 experimental replicates; each data point represents an independent experiment using CV or GF FC-FM collected from a different fish flask. ∗p < 0.05, paired t test. (F) Histogram of the number of predicted proteins in the zebrafish genome, binned according to % proline. Pro, proline. (G) Quantification of WTanc (black outlined bars) and ΔspdE (blue outlined bars) motility (exploration assay) in supernatant from collagenase-digested larval zebrafish (Col + F). Supernatant from untreated fish (Fish), untreated fish spiked with proline (F + Pro), and a collagenase only (Col) are included as references. Each data point represents an independent experiment; “reference” strain/condition indicated on bottom. n = 2 experimental replicates. Bar, mean. Dotted line represents fold change of 1 (i.e., no difference). See also Figure S7.