
|
Fig. 4
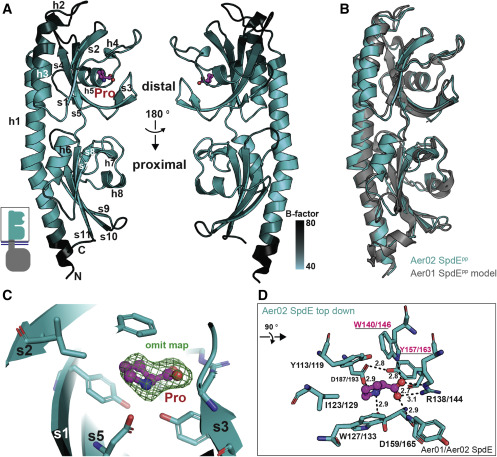
Figure 4. SpdE tPAS/dCache crystal structure provides insight into ligand binding (A) Ribbon diagram of Aer02 SpdEpp structure with proline bound (pink). Secondary elements are labeled (h, helix; s, beta strand). Shading based on atomic mobility (B-factors, black, more flexible; lighter teal, less flexible). PDB: 7K5N. (B) I-TASSER model of Aer01 SpdEpp structure (gray) superimposed onto Aer02 SpdEpp crystal structure (teal). (C) Detail of the distal PAS/Cache proline binding pocket showing Fo-Fc “omit” electron density for proline as green mesh (contour level, 2.0 sigma). (D) The eight distal SpdE residues and one main chain NH ligating bound proline are shown as teal sticks, bound proline in pink. Aer01/02 sequence numbering shows identically conserved binding site residues. Underlined residues indicate targets of site-directed mutagenesis, see Figure 3D. Hydrogen bonds to proline are shown, distances in angstroms. For (A), (C), and (D): red, oxygen; blue, nitrogen.