
Fig. 3
- ID
- ZDB-FIG-221001-9
- Publication
- Robinson et al., 2021 - Host-emitted amino acid cues regulate bacterial chemokinesis to enhance colonization
- Other Figures
- All Figure Page
- Back to All Figure Page
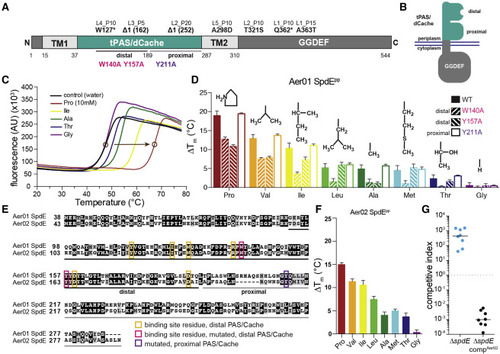
Figure 3. SpdE protein architecture and ligand binding (A) SpdE protein architecture. Aer01 SpdE residue numbers are below the bar. Specific mutations in the evolved isolates are labeled at their approximate locations (see Table S1). (B) Schematic of SpdE integrated into the inner cell membrane. (C) Representative thermal shift assay curves of the tPAS/dCache region of Aer01 SpdE (SpdEpp). Circles show approximate melting temperatures (Tm) for control and proline. (D) Thermal shift results (L-amino acids relative to control) of Aer01 SpdEpp WT and three point mutants. Amino acid side chains (R group are drawn above the bars. n ≥ 6 technical replicates, 2–3 experimental replicates, bars represent mean + SD. (E) Alignment of Aer01 and Aer02 SpdE amino acid sequences (tPAS/dCache domains only). Gray-highlighted residues, similar; black, identical; white, dissimilar. Pink and yellow boxes indicate putative binding site residues in the distal PAS/Cache domain and pink and purple boxes are residues mutated to assess ligand-binding location, see (D). (F) Thermal shift assay results of Aer02 SpdEpp. n ≥ 6 technical replicates, 2–3 experimental replicates, bars represent mean + SD. (G) Competitive index data showing that Aer02 spdE can functionally complement Aer01 spdE in Aer01. See also Figures S3 and S4. |