
|
Fig. 1
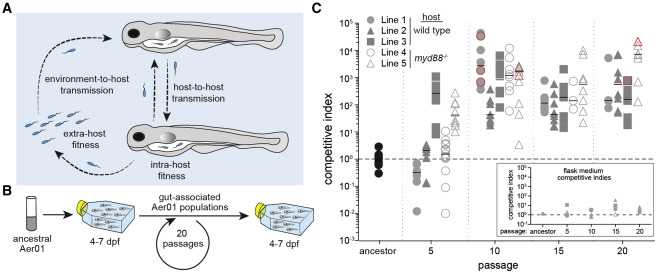
Figure 1. Rapid and reproducible adaptation of Aer01 serially passaged in populations of larval zebrafish (A) Schematic of the Aer01 colonization cycle within a host population and potential adaptive strategies. (B) Evolution experiment passaging scheme (dpf, days post-fertilization). (C) Competitive indices (CI) of Aer01 ancestor and evolved isolates, competed with an ancestral reference strain (see also Figure S1A). Each data point represents the CI from an individual fish. Lines 1–3 (gray filled symbols) were evolved in WT hosts; lines 4 and 5 (gray open symbols) were evolved in myd88−/− hosts. Points outlined in red represent a lower bound for the actual CI (see STAR Methods). Black bar, median. n ≥ 4 fish/condition, one experimental replicate. Dotted line indicates CI of 1 (i.e., no competitive advantage). Inset graph presents CI data for isolates in the flask medium (a single point for each flask); y axis and symbols match the main graph. See also Figure S1.