
- Title
-
Systems Toxicology Approach for Assessing Developmental Neurotoxicity in Larval Zebrafish
- Authors
- Li, R.A., Talikka, M., Gubian, S., Vom Berg, C., Martin, F., Peitsch, M.C., Hoeng, J., Zupanic, A.
- Source
- Full text @ Front Genet
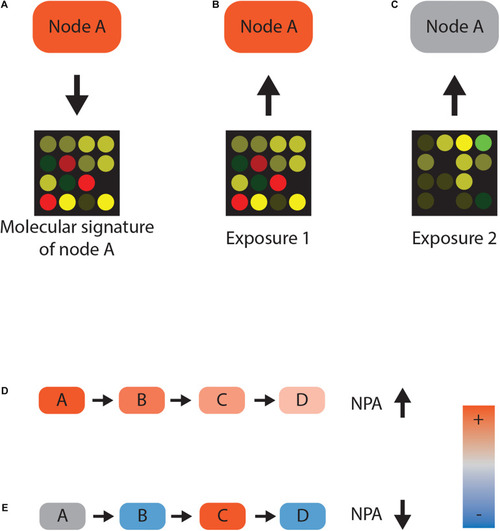
Network scoring. (A–C) Reverse causal reasoning paradigm. Gene expression data following activation of protein A can be used as a molecular signature for the activity of that protein A. Any given transcriptomic dataset—for example, from chemically exposed samples—can now be used to infer the activity of protein A. Closely matching gene expression values indicate that protein A was active (B), whereas disparate gene expression is not consistent with the activity (C). (D,E) Network perturbation amplitude (NPA) calculation. If nodes A, B, and C positively regulate node D and their activities are inferred to be high, there is a high consistency between gene expression and network topology. High consistency leads to a high NPA value (D). Conversely, if node activity and the topology of the network contradict each other, the NPA value decreases (E). |
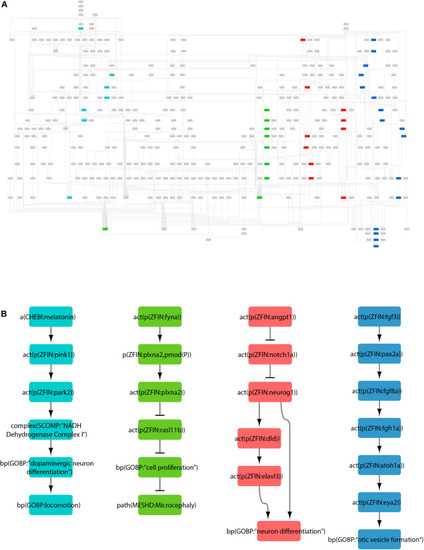
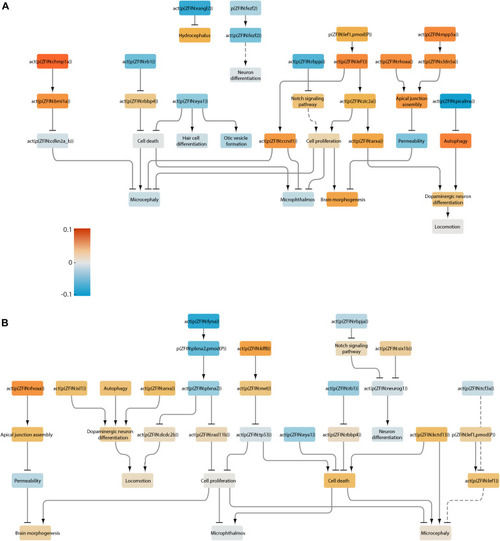
The zebrafish neurotoxicity network. |
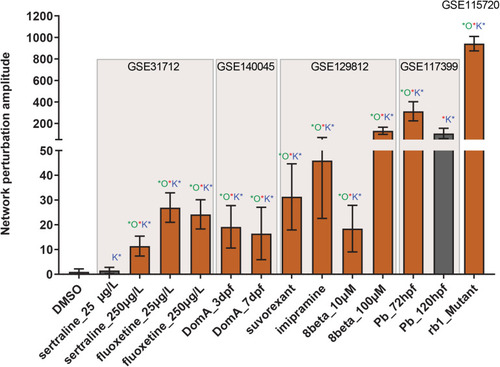
Neurotoxicity network perturbation amplitude (NPA). NPA values are shown as fold change over DMSO control with proportional adjustment of confidence intervals. Beige rectangles highlight separate transcriptomic datasets. Red stars indicate significant NPA values. Green stars indicate significant o statistic values — a measure of how specific the given perturbation is to the current network. Blue stars indicate significant o statistic values — a measure of the quality of the functional layer. Orange bars indicate significant perturbation, while gray bars represent values where at least one statistic was not significant. |
Neurotoxicity network scored with the transcriptome of rb1 mutant larvae. |
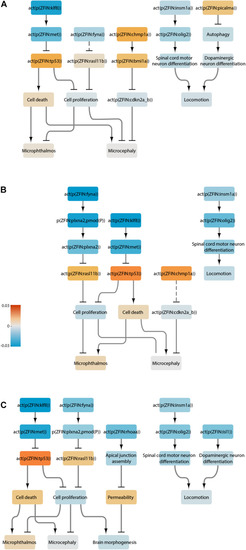
Neurotoxicity network scored with the transcriptomes of larvae treated with selective serotonin reuptake inhibitors. |
Neurotoxicity network scored with the transcriptomes of larvae treated with lead. |
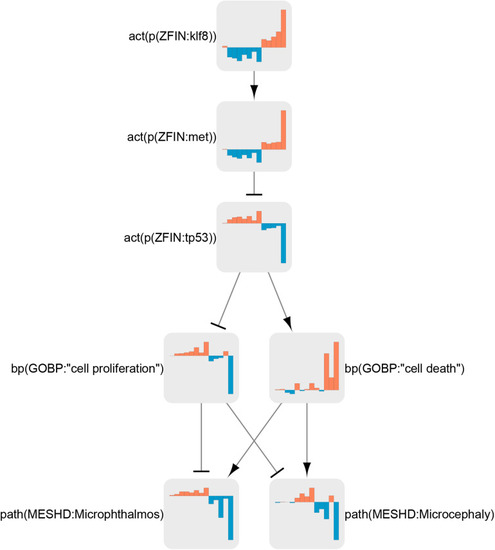
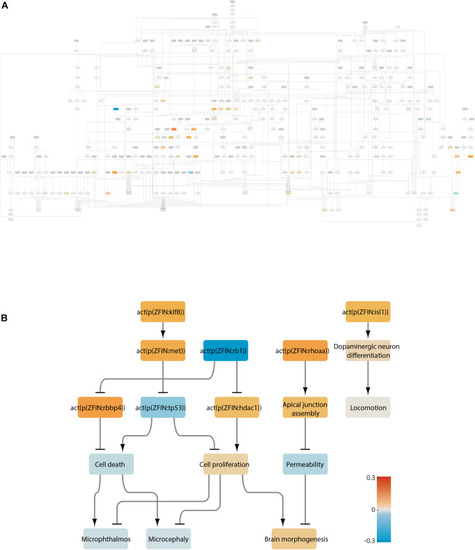
Klf8 regulation in the neurotoxicity network. Node coefficient values (see section “Materials and Methods”) for all treatments are shown as bar graphs. Bars from left to right correspond to neuroactive (ser 25 μg/L, ser 250 μg/L, flu 25 μg/L, flu 250 μg/L, suvo, imip, 8beta 10 μM, and 8beta 100) and neurotoxic (domo 3 dpf, domo 7 dpf, Pb 72 hpf, Pb 120 hpf, and rb1) conditions. Orange bars indicate activation, and blue bars indicate inactivation. |