
Image
|
Figure Caption
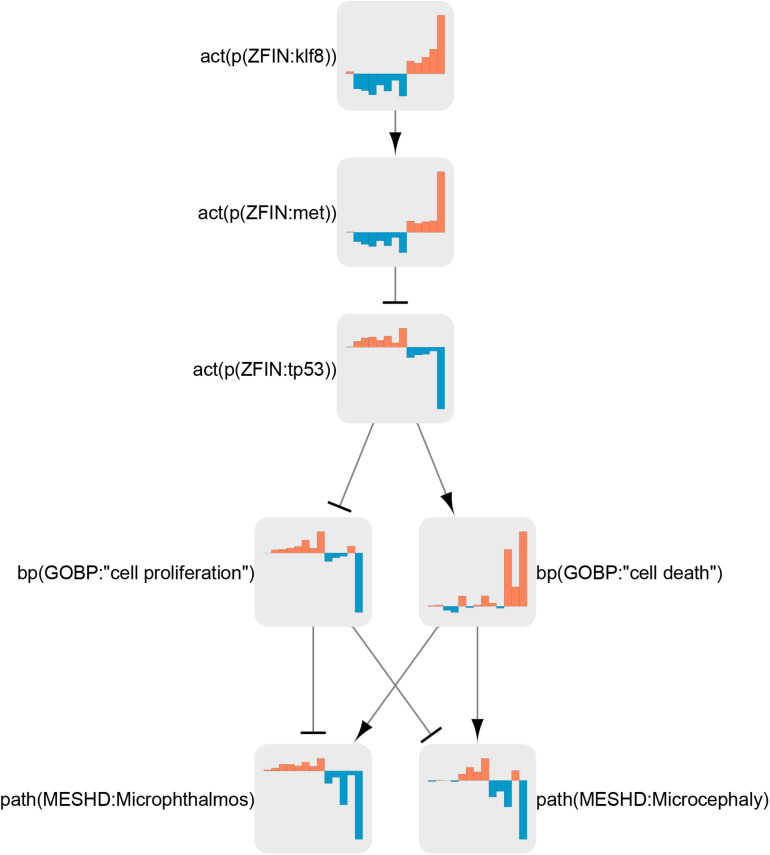
FIGURE 7
Klf8 regulation in the neurotoxicity network. Node coefficient values (see section “Materials and Methods”) for all treatments are shown as bar graphs. Bars from left to right correspond to neuroactive (ser 25 μg/L, ser 250 μg/L, flu 25 μg/L, flu 250 μg/L, suvo, imip, 8beta 10 μM, and 8beta 100) and neurotoxic (domo 3 dpf, domo 7 dpf, Pb 72 hpf, Pb 120 hpf, and rb1) conditions. Orange bars indicate activation, and blue bars indicate inactivation.
Acknowledgments
This image is the copyrighted work of the attributed author or publisher, and
ZFIN has permission only to display this image to its users.
Additional permissions should be obtained from the applicable author or publisher of the image.
Full text @ Front Genet