
|
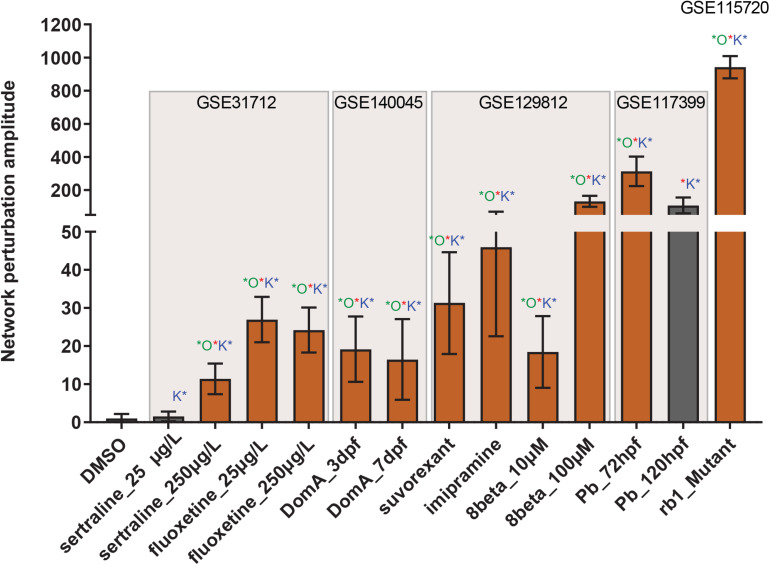
FIGURE 3
Neurotoxicity network perturbation amplitude (NPA). NPA values are shown as fold change over DMSO control with proportional adjustment of confidence intervals. Beige rectangles highlight separate transcriptomic datasets. Red stars indicate significant NPA values. Green stars indicate significant o statistic values — a measure of how specific the given perturbation is to the current network. Blue stars indicate significant o statistic values — a measure of the quality of the functional layer. Orange bars indicate significant perturbation, while gray bars represent values where at least one statistic was not significant.