
FIGURE 1
- ID
- ZDB-FIG-210705-4
- Publication
- Li et al., 2021 - Systems Toxicology Approach for Assessing Developmental Neurotoxicity in Larval Zebrafish
- Other Figures
- All Figure Page
- Back to All Figure Page
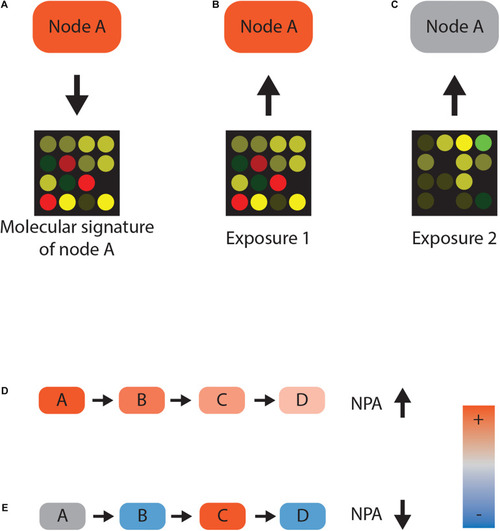
Network scoring. (A–C) Reverse causal reasoning paradigm. Gene expression data following activation of protein A can be used as a molecular signature for the activity of that protein A. Any given transcriptomic dataset—for example, from chemically exposed samples—can now be used to infer the activity of protein A. Closely matching gene expression values indicate that protein A was active (B), whereas disparate gene expression is not consistent with the activity (C). (D,E) Network perturbation amplitude (NPA) calculation. If nodes A, B, and C positively regulate node D and their activities are inferred to be high, there is a high consistency between gene expression and network topology. High consistency leads to a high NPA value (D). Conversely, if node activity and the topology of the network contradict each other, the NPA value decreases (E). |