
- Title
-
Vimentin Promotes the Aggressiveness of Triple Negative Breast Cancer Cells Surviving Chemotherapeutic Treatment
- Authors
- Winter, M., Meignan, S., Völkel, P., Angrand, P.O., Chopin, V., Bidan, N., Toillon, R.A., Adriaenssens, E., Lagadec, C., Le Bourhis, X.
- Source
- Full text @ Cells
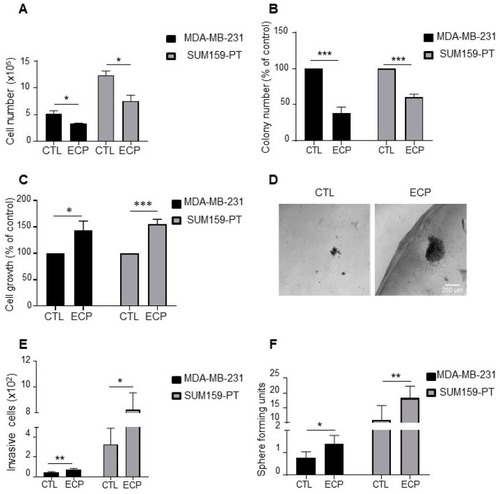
Phenotype characterization of TNBC persistent cells. MDA-MB-231 cells were treated with 8 nM epirubicin and 40 nM cyclophosphamide for 48 h, and then with 1 nM paclitaxel for another 48 h. SUM159-PT cells were treated with 40 nM epirubicin and 200 nM cyclophosphamide for 48 h and then with 2 nM paclitaxel for another 48 h. After drug treatment (ECP), cells were maintained in culture for 4 days to mimic post-therapy scenario. (A) Cell count under 2D conditions with a hemocytometer four days after treatment. (B) Clonogenic growth. Four days after ECP treatment, cells were harvested and cultured in medium containing 10% FCS for 7 days. Colony formation was evaluated after crystal violet staining. (C,D) Cell growth in Matrigel. Four days after ECP treatment, cells were seeded in a mix solution of media containing 1% FCS and Matrigel (v:v, 1:1) to form a droplet, and then cultured in media containing 10% FCS for 10 days. At the end of culture, cells were extracted from Matrigel and counted with a hemocytometer. (C) Cell growth quantification and (D) Illustration of cells cultured in Matrigel. Scale bar is 100 µm. (E) Four days after treatment, MDA-MB-231 and SUM159-PT cells were seeded in the top of Boyden microchambers precoated with Matrigel. Invasive cells were counted following 24 h of culture. (F) Sphere formation of persistent cells. Sphere forming units, calculated as the number of spheres over the number of initially seeded cells. Quantitative graphics correspond to at least 3 independent experiments and the illustrations are representative of 3 independent experiments. *, p <0.05; **, p < 0.01; ***, p < 0.001. Unpaired Student t-test. |
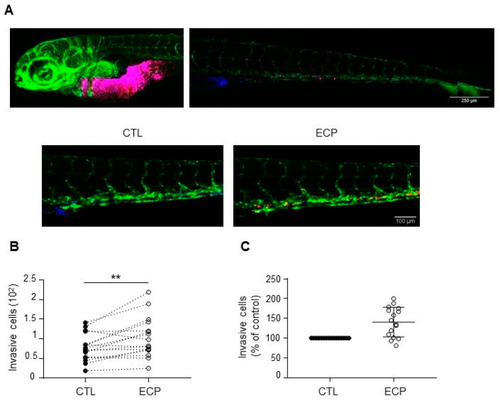
Invasion of MDA-MB-231 cells in xenografted zebrafish embryo. Equal quantities of control and persistent cells were mixed and then co-injected into in the yolk sac of zebrafish embryos before confocal analyses at 3 days post-injection as described in materials and methods. (A) Images of embryos at 3 days post-injection. Top panel shows merged images of control (blue) and persistent cells (red) at the injected site and in the tail of an embryo. Scale bar is 500 µm. Bottom panel shows separate images of control (blue) or persistent cells (red) in an embryo tail. Scale bar is 100 µm. Pictures were taken under a Zeiss confocal microscope (10×). (B) Graphic showing the number of invasive cells (persistent cells vs. control) in each zebrafish embryo (n = 16). (C) Relative quantification of invasion. Invasion of persistent dells was expressed as the percent of control cells in each embryo (n = 16). Illustrations and quantitative graphics are representative of 2 independent experiments, with 16 zebrafish embryos analyzed in each experiment. **, p < 0.01. Paired Student t-test. |
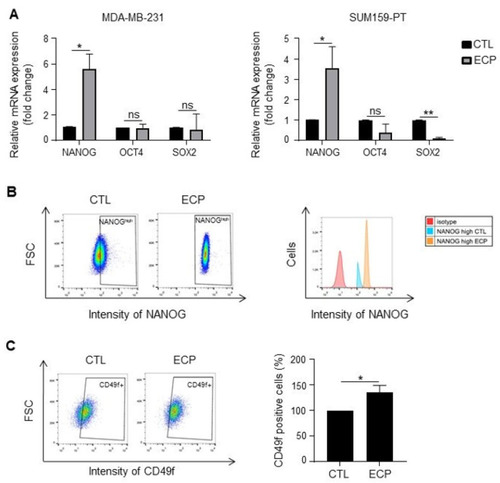
Expression of cancer stem cell markers in TNBC cells. Analyses were performed four days after ECP treatment. (A) Real-time PCR analysis of mRNA levels of pluripotency factors NANOG, OCT4 and SOX2 in MDA-MB-231 and SUM159-PT cells. RPLP0 mRNA was used to normalize variability in template loading. Data from control cells were set as 1, relative mRNA expression was evaluated by fold-change. (B,C) Flow cytometry analysis of cancer stem cell markers NANOG and CD49f in MDA-MB-231 cells. Cells were incubated with antibodies against NANOG and CD49f, and then analyzed by flow cytometry with FITC or APC filter, respectively. Isotype antibodies were used as controls. (B) Flow cytometry analysis of NANOGhigh population. Cells with fluorescence intensity ≥ log 102 were considered as NANOGhigh. Data were representative of 3 independent experiences (C) Flow cytometry analysis of CD49f positive sub-population. Quantitative graphics correspond to 3 independent experiments and illustrations are representative of 3 independent experiments. ns, not significant; *, p < 0.05; **, p < 0.01. Unpaired Student t-test. |
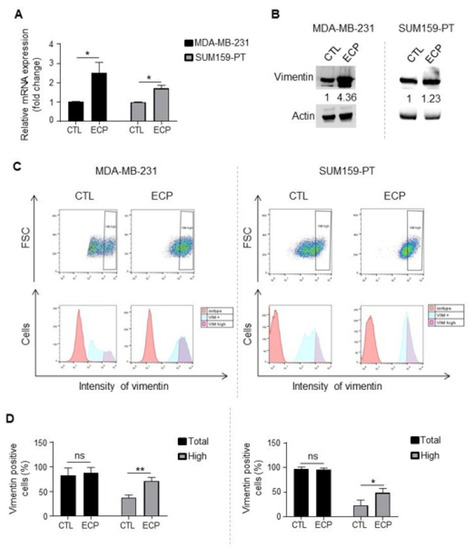
Vimentin expression in TNBC cells. Analyses were performed four days after ECP treatment. (A) Real-time PCR analysis of mRNA levels of vimentin. RPLP0 mRNA was used to normalize variability in template loading. Data from control cells were set as 1, relative mRNA expression was evaluated by fold-change. (B) Western blot analysis of vimentin. Actin was used as loading control. (C) Flow cytometry analysis of vimentinhigh sub-population. Cells were incubated with an antibody against vimentin and analyzed by flow cytometry with APC filter. Isotype antibody was used as control. Cells with APC fluorescence intensity ≥ log 103 were considered as vimentinhigh. (D) Quantification of vimentin positive and vimentinhigh sub-population in MDA-MB-231 cells (left panel) or SUM159-PT (right panel) cells. Quantitative graphics correspond to 3 independent experiments and illustrations are representative of 3 independent experiments. ns, not significant; *, p < 0.05; **, p < 0.01. Unpaired Student t-test. |
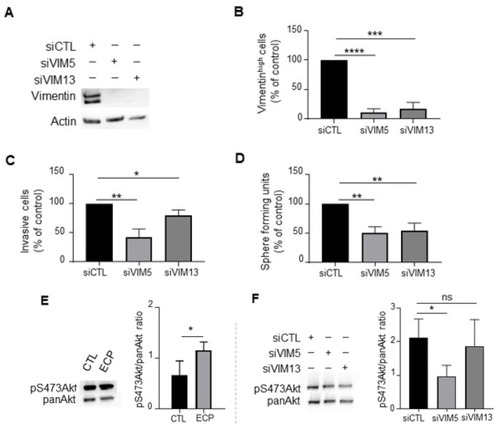
Effects of vimentin silencing on invasion, sphere formation and Akt phosphorylation in MDA-MB-231 persistent cells. Four days after ECP treatment, MDA-MB-231 persistent cells were seeded and cultured for 24 h before transfection with 2 sequences of siRNA targeting vimentin (VIM5, VIM13). Three days after transfection, vimentin levels were determined by Western blotting (A), or flow cytometry analysis to quantify vimentinhigh sub-population (B). Cells with fluorescence intensity ≥ log 103 were considered as vimentinhigh. (C) Effect of vimentin silencing on invasion of persistent cells. Three days after transfection with siRNA against vimentin, MDA-MB-231 persistent cells were seeded in the top of Boyden microchambers precoated with Matrigel. Invasive cells were counted following 24 h of culture. (D) Effect of vimentin silencing on sphere formation of persistent cells. Three days after transfection with siRNA against vimentin, MDA-MB-231 persistent cells were cultured in suspension in defined medium as described in materials and methods. The number of spheres was counted under a contrast phase microscope after 7 days of culture. (E) Western blot analysis of pS473Akt in control and persistent cells. Actin was used as loading control. (F) Western blot analysis of pan-Akt and pS473Akt in vimentin silenced persistent cells. Pan-Akt was used as loading control. Quantitative graphics correspond to 3 independent experiments and illustrations are representative of 3 independent experiments. ns, not significant; *, p < 0.05; **, p < 0.01; ***, p < 0.001; ****, p < 0.00001. Unpaired Student t-test. |
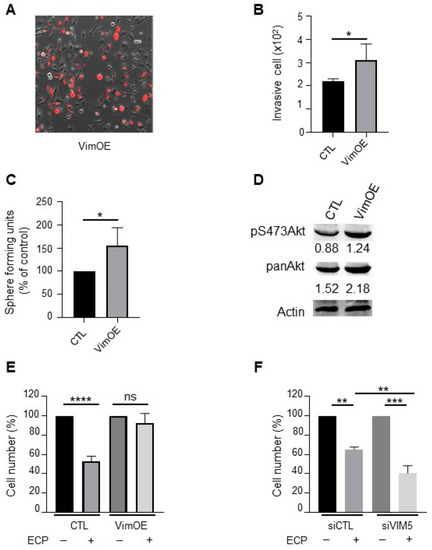
Effect of vimentin overexpression on invasion, sphere formation, Akt activation and drugs sensitivity in MDA-MB-231 wild type cells. MDA-MB-231 wild type cells were seeded and cultured 24 h before transfection with plasmid overexpressing vimentin (VimOE) or control (CTL). The day after transfection, vimentin expression was evaluated by fluorescent microscopy with the texas red filter (A; Nikon, 10x). All experiments were performed 24 h after transfection. (B) Effect of VimOE on invasion. VimOE cells were seeded on the top of Boyden micro-chambers precoated with Matrigel. Invasive cells were counted following 24 h of culture. (C) Effect of VimOE on sphere formation. VimOE cells were cultured in suspension in defined medium described in materials and methods. The number of spheres was counted under a contrast phase microscope after 7 days of culture. (D) Western blot analysis of pan-Akt and pS473Akt in MDA-MB-231 VimOE cells. Actine was used as loading control. (E,F) Vimentin effect in drug sensibility. MDA-MB-231 wild type cells were seeded and cultivate 24 h before transfection with siRNA or plasmid targeted vimentin expression level similar as is previously described. The day after transfection, cells inhibited or overexpressed vimentin were seeded and then treated in first during 48 h with 8 nM epirubicin and 40 nM cyclophosphamide, and then 1 nM paclitaxel for another 48 h in medium containing 1% FCS. After the 96 h of treatment, the cells were count with hemocytometer. (E) MDA-MB-231 wild type cells silencing for vimentin (siVIM5, siVIM13) or with the siRNA control (siCTL). (F) MDA-MB-231 wild type cells overexpressing vimentin (VimOE) or control (CTL). Quantitative graphics correspond to 3 independent experiments. ns, not significant; *, p < 0.05; **, p < 0.01; ***, p < 0.005; ****, p < 0.0001. Unpaired Student t-test. |