
Figure 2
- ID
- ZDB-FIG-210707-45
- Publication
- Winter et al., 2021 - Vimentin Promotes the Aggressiveness of Triple Negative Breast Cancer Cells Surviving Chemotherapeutic Treatment
- Other Figures
- All Figure Page
- Back to All Figure Page
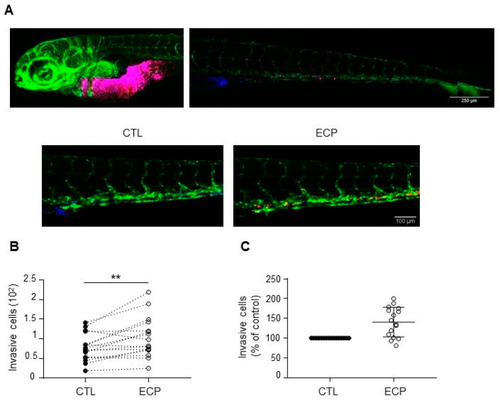
Invasion of MDA-MB-231 cells in xenografted zebrafish embryo. Equal quantities of control and persistent cells were mixed and then co-injected into in the yolk sac of zebrafish embryos before confocal analyses at 3 days post-injection as described in materials and methods. (A) Images of embryos at 3 days post-injection. Top panel shows merged images of control (blue) and persistent cells (red) at the injected site and in the tail of an embryo. Scale bar is 500 µm. Bottom panel shows separate images of control (blue) or persistent cells (red) in an embryo tail. Scale bar is 100 µm. Pictures were taken under a Zeiss confocal microscope (10×). (B) Graphic showing the number of invasive cells (persistent cells vs. control) in each zebrafish embryo (n = 16). (C) Relative quantification of invasion. Invasion of persistent dells was expressed as the percent of control cells in each embryo (n = 16). Illustrations and quantitative graphics are representative of 2 independent experiments, with 16 zebrafish embryos analyzed in each experiment. **, p < 0.01. Paired Student t-test. |