
Figure 6
- ID
- ZDB-FIG-210707-25
- Publication
- Winter et al., 2021 - Vimentin Promotes the Aggressiveness of Triple Negative Breast Cancer Cells Surviving Chemotherapeutic Treatment
- Other Figures
- All Figure Page
- Back to All Figure Page
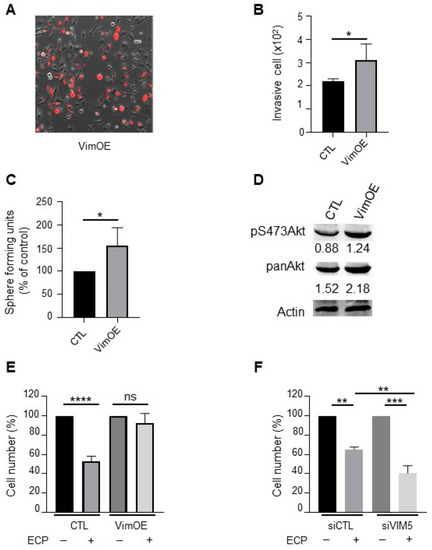
Effect of vimentin overexpression on invasion, sphere formation, Akt activation and drugs sensitivity in MDA-MB-231 wild type cells. MDA-MB-231 wild type cells were seeded and cultured 24 h before transfection with plasmid overexpressing vimentin (VimOE) or control (CTL). The day after transfection, vimentin expression was evaluated by fluorescent microscopy with the texas red filter (A; Nikon, 10x). All experiments were performed 24 h after transfection. (B) Effect of VimOE on invasion. VimOE cells were seeded on the top of Boyden micro-chambers precoated with Matrigel. Invasive cells were counted following 24 h of culture. (C) Effect of VimOE on sphere formation. VimOE cells were cultured in suspension in defined medium described in materials and methods. The number of spheres was counted under a contrast phase microscope after 7 days of culture. (D) Western blot analysis of pan-Akt and pS473Akt in MDA-MB-231 VimOE cells. Actine was used as loading control. (E,F) Vimentin effect in drug sensibility. MDA-MB-231 wild type cells were seeded and cultivate 24 h before transfection with siRNA or plasmid targeted vimentin expression level similar as is previously described. The day after transfection, cells inhibited or overexpressed vimentin were seeded and then treated in first during 48 h with 8 nM epirubicin and 40 nM cyclophosphamide, and then 1 nM paclitaxel for another 48 h in medium containing 1% FCS. After the 96 h of treatment, the cells were count with hemocytometer. (E) MDA-MB-231 wild type cells silencing for vimentin (siVIM5, siVIM13) or with the siRNA control (siCTL). (F) MDA-MB-231 wild type cells overexpressing vimentin (VimOE) or control (CTL). Quantitative graphics correspond to 3 independent experiments. ns, not significant; *, p < 0.05; **, p < 0.01; ***, p < 0.005; ****, p < 0.0001. Unpaired Student t-test. |