
Figure 4
- ID
- ZDB-IMAGE-210707-11
- Publication
- Winter et al., 2021 - Vimentin Promotes the Aggressiveness of Triple Negative Breast Cancer Cells Surviving Chemotherapeutic Treatment
- All Figures
- Figures for Winter et al., 2021
|
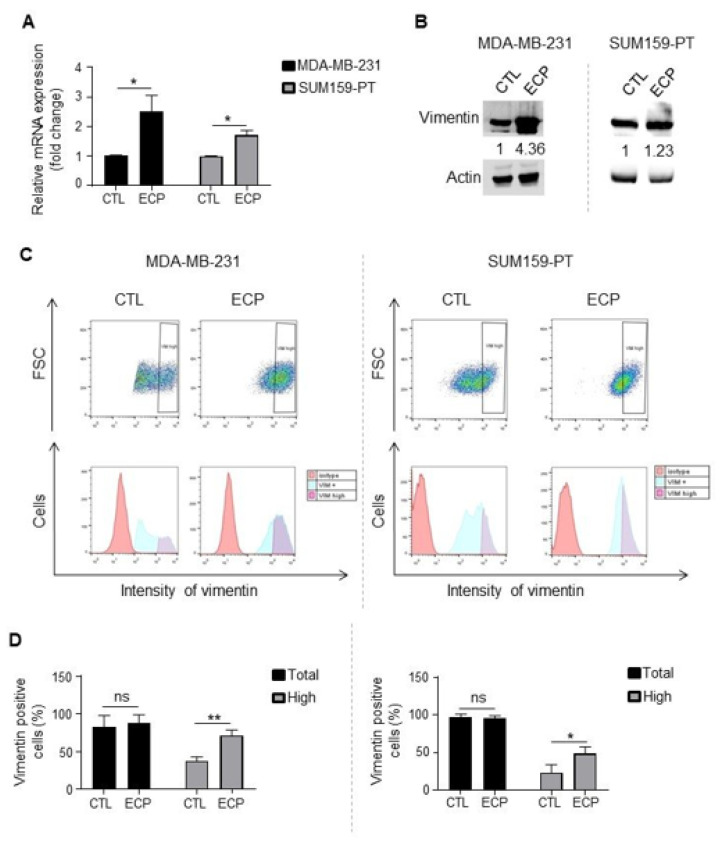
Figure 4 Vimentin expression in TNBC cells. Analyses were performed four days after ECP treatment. (A) Real-time PCR analysis of mRNA levels of vimentin. RPLP0 mRNA was used to normalize variability in template loading. Data from control cells were set as 1, relative mRNA expression was evaluated by fold-change. (B) Western blot analysis of vimentin. Actin was used as loading control. (C) Flow cytometry analysis of vimentinhigh sub-population. Cells were incubated with an antibody against vimentin and analyzed by flow cytometry with APC filter. Isotype antibody was used as control. Cells with APC fluorescence intensity ≥ log 103 were considered as vimentinhigh. (D) Quantification of vimentin positive and vimentinhigh sub-population in MDA-MB-231 cells (left panel) or SUM159-PT (right panel) cells. Quantitative graphics correspond to 3 independent experiments and illustrations are representative of 3 independent experiments. ns, not significant; *, p < 0.05; **, p < 0.01. Unpaired Student t-test.