
Figure 1
- ID
- ZDB-IMAGE-210707-48
- Publication
- Winter et al., 2021 - Vimentin Promotes the Aggressiveness of Triple Negative Breast Cancer Cells Surviving Chemotherapeutic Treatment
- All Figures
- Figures for Winter et al., 2021
|
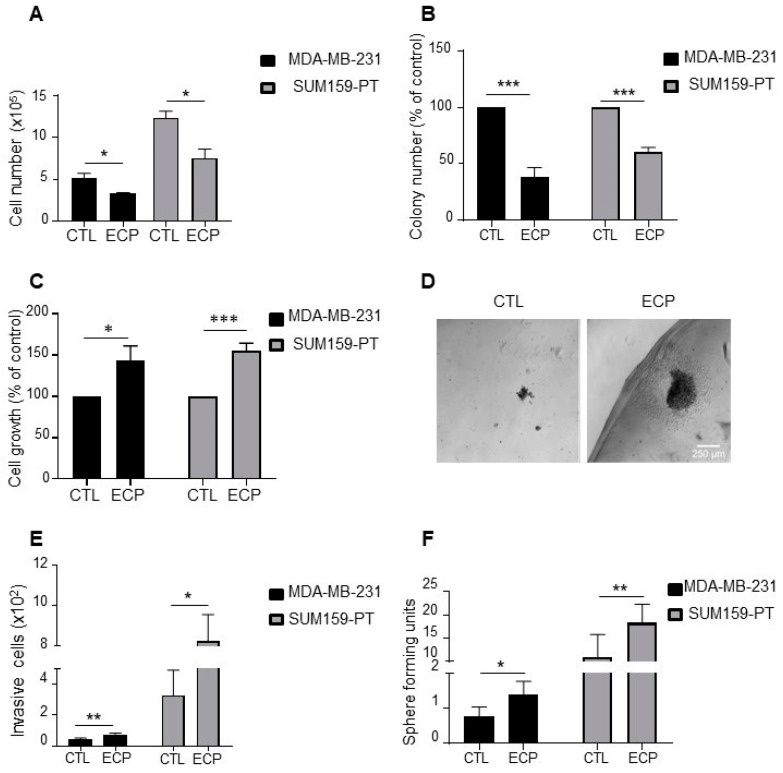
Figure 1 Phenotype characterization of TNBC persistent cells. MDA-MB-231 cells were treated with 8 nM epirubicin and 40 nM cyclophosphamide for 48 h, and then with 1 nM paclitaxel for another 48 h. SUM159-PT cells were treated with 40 nM epirubicin and 200 nM cyclophosphamide for 48 h and then with 2 nM paclitaxel for another 48 h. After drug treatment (ECP), cells were maintained in culture for 4 days to mimic post-therapy scenario. (A) Cell count under 2D conditions with a hemocytometer four days after treatment. (B) Clonogenic growth. Four days after ECP treatment, cells were harvested and cultured in medium containing 10% FCS for 7 days. Colony formation was evaluated after crystal violet staining. (C,D) Cell growth in Matrigel. Four days after ECP treatment, cells were seeded in a mix solution of media containing 1% FCS and Matrigel (v:v, 1:1) to form a droplet, and then cultured in media containing 10% FCS for 10 days. At the end of culture, cells were extracted from Matrigel and counted with a hemocytometer. (C) Cell growth quantification and (D) Illustration of cells cultured in Matrigel. Scale bar is 100 µm. (E) Four days after treatment, MDA-MB-231 and SUM159-PT cells were seeded in the top of Boyden microchambers precoated with Matrigel. Invasive cells were counted following 24 h of culture. (F) Sphere formation of persistent cells. Sphere forming units, calculated as the number of spheres over the number of initially seeded cells. Quantitative graphics correspond to at least 3 independent experiments and the illustrations are representative of 3 independent experiments. *, p <0.05; **, p < 0.01; ***, p < 0.001. Unpaired Student t-test.