
- Title
-
Sub-chronic exposure to antibiotics doxycycline, oxytetracycline or florfenicol impacts gut barrier and induces gut microbiota dysbiosis in adult zebrafish (Daino rerio)
- Authors
- Qian, M., Wang, J., Ji, X., Yang, H., Tang, B., Zhang, H., Yang, G., Bao, Z., Jin, Y.
- Source
- Full text @ Ecotoxicol. Environ. Saf.
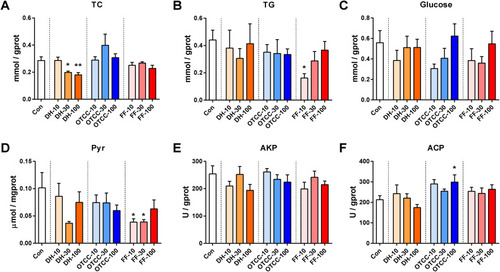
Effects of antibiotic exposure on biochemical parameters. A: Total cholesterol (TC) levels; B: Triglyceride (TG) levels; C: Glucose (Glu) levels; D: Pyruvate levels; E: Alkaline phosphatase (AKP) levels; F: Acid phosphatase (ACP) levels. The presented values in the figure are the means ± SEMs (n = 6). *p < 0.05, **p < 0.01 versus control group. PHENOTYPE:
|
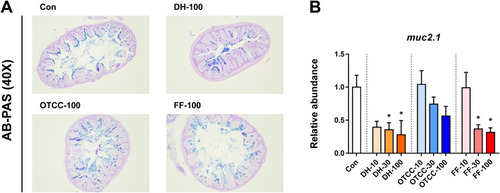
Antibiotic exposure altered mucus secretion in the zebrafish gut. A: AB-PAS stain of the zebrafish gut after antibiotics exposure; B: The mRNA level of muc2.1. The presented values in the figure are the means ± SEMs (n = 6). *p < 0.05 versus control group. |
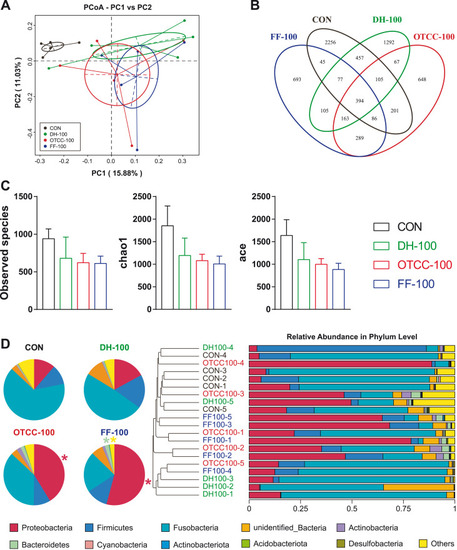
The composition of gut microbiota after antibiotic exposure. A: Principal coordinates analysis (PCoA) in all groups; B: Venn diagram in all groups; C: Alpha-diversity; D: Unweighted pair-group method with arithmetic mean (UPGMA). PHENOTYPE:
|
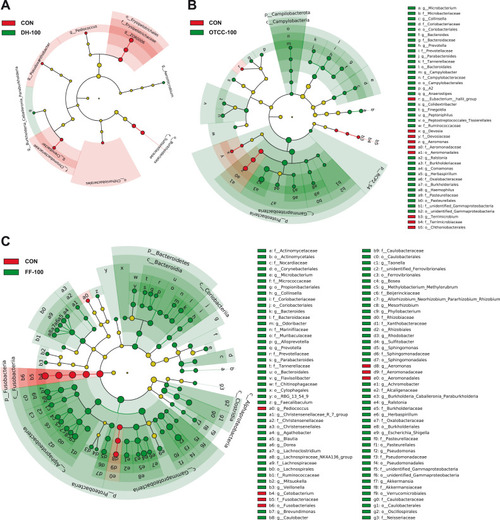
Linear discriminant analysis effect size (LEfSe) comparison analysis between the control group and the antibiotic-treated group (LDA score > 2). A: DH-100 group; B: OTCC-100 group; C: FF-100 group. PHENOTYPE:
|
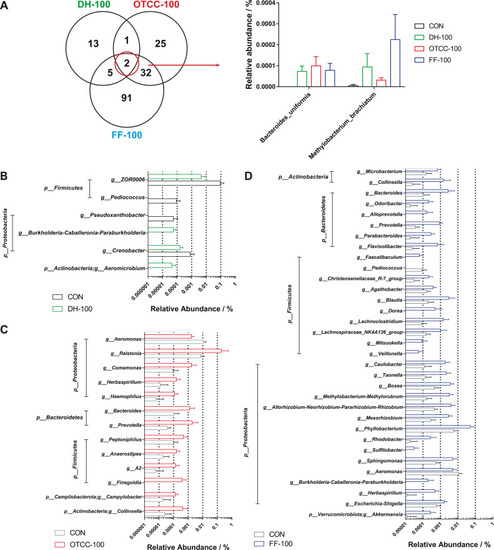
The difference in the genera after antibiotic treatment. A: Venn diagram of LEfSe in three groups; Significantly changed genera in DH-100 group (B), OTCC-100 group (C) and FF-100 group (D). PHENOTYPE:
|
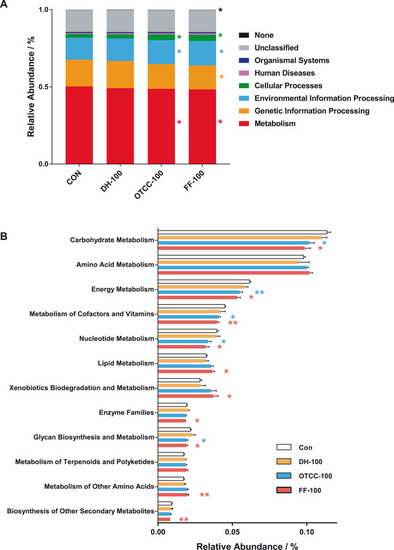
Phylogenetic Investigation of Communities by Reconstruction of Unobserved States (PICRUSt). A: Level 1 in KEGG; B: Level 2 in the term of Metabolism. |
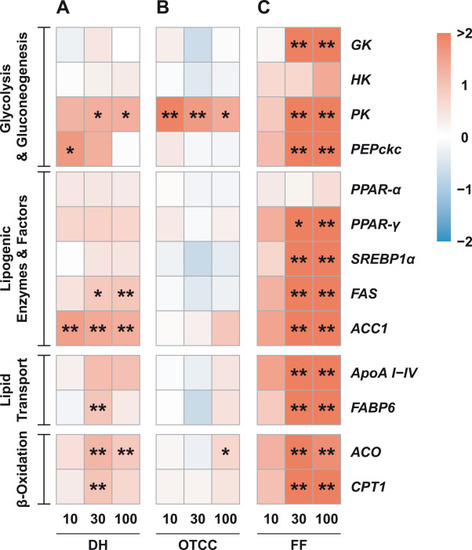
Heatmap of the glucose and lipid metabolism-related gene transcript levels in the liver after antibiotic exposure. A: DH-treated group; B: OTCC-treated group; C: FF-treated group. *p < 0.05, **p < 0.01 versus control group. |