
Image
|
Figure Caption
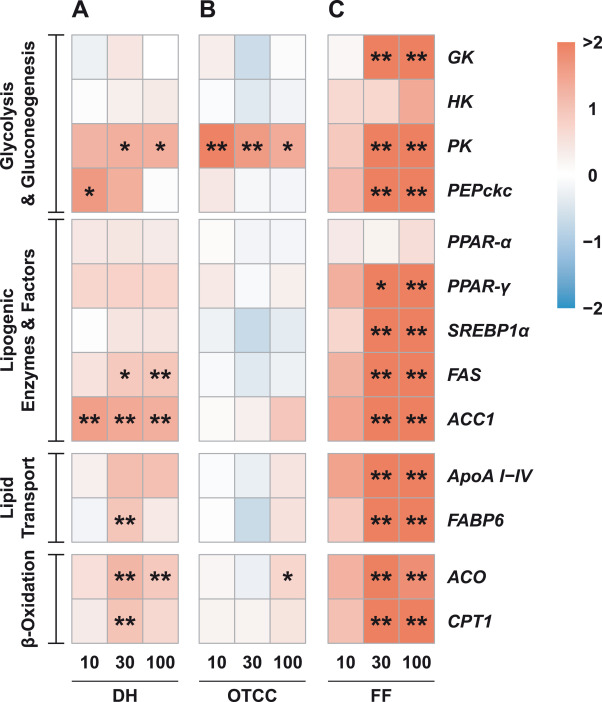
Fig. 7 Heatmap of the glucose and lipid metabolism-related gene transcript levels in the liver after antibiotic exposure. A: DH-treated group; B: OTCC-treated group; C: FF-treated group. *p < 0.05, **p < 0.01 versus control group.
Figure Data
Acknowledgments
This image is the copyrighted work of the attributed author or publisher, and
ZFIN has permission only to display this image to its users.
Additional permissions should be obtained from the applicable author or publisher of the image.
Full text @ Ecotoxicol. Environ. Saf.