
Image
|
Figure Caption
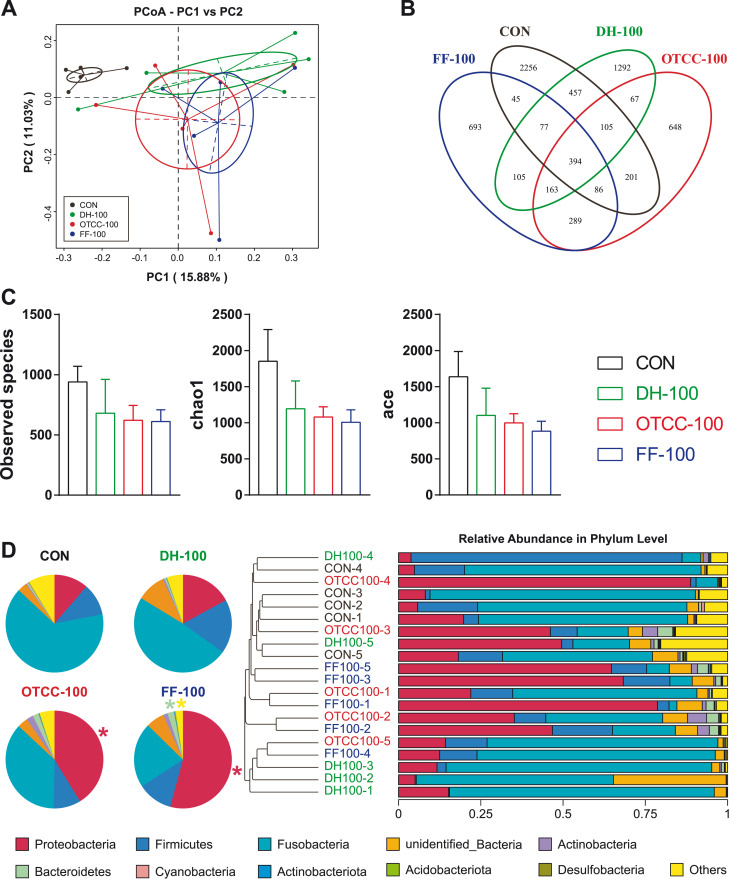
Fig. 3 The composition of gut microbiota after antibiotic exposure. A: Principal coordinates analysis (PCoA) in all groups; B: Venn diagram in all groups; C: Alpha-diversity; D: Unweighted pair-group method with arithmetic mean (UPGMA).
Figure Data
Acknowledgments
This image is the copyrighted work of the attributed author or publisher, and
ZFIN has permission only to display this image to its users.
Additional permissions should be obtained from the applicable author or publisher of the image.
Full text @ Ecotoxicol. Environ. Saf.