FIGURE SUMMARY
Title

Analysis of gene network bifurcation during optic cup morphogenesis in zebrafish

Authors
Buono, L., Corbacho, J., Naranjo, S., Almuedo-Castillo, M., Moreno-Marmol, T., de la Cerda, B., Sanbria-Reinoso, E., Polvillo, R., Díaz-Corrales, F.J., Bogdanovic, O., Bovolenta, P., Martínez-Morales, J.R.
Source
Full text @ Nat. Commun.

Experimental setup and raw data.

a Schematic representation of optic vesicle morphogenesis from undifferentiated retinal progenitor cells (PG, blue), at 16 hpf, to segregation and differentiation of the neural retina (NR, purple) and pigmented epithelium (RPE, orange) domains at 18 and 23 hpf. NR and RPE populations isolated by flow cytometry were analyzed by RNA-seq and ATAC-seq at the stages indicated. b Stage 23 hpf confocal sections from the zebrafish transgenic lines used to mark and isolate the RPE (E1_bHLHe40:GFP) and NR (vsx2.2:GFP) populations. Bar = 50 µm. c Multidimensional scaling analysis of the RNA-seq data showing a progressive transcriptomic divergence between the NR and RPE domains. d Percentage of overlapping between differentially expressed genes (DEGs) and genes associated with differentially opened chromatin regions (DOCRs). e, f Overview of ATAC-seq and RNA-seq tracks (UCSC browser) for representative NR (vsx1; (e)) and RPE (mitfa; (f)) specific genes. Solid bars on the top indicate DOCRs. If purple, the DOCR is more accessible in the NR. On the contrary, if orange, the DOCR is more accessible in the RPE. In the depicted case all the DOCRs are accompanied by increased transcription of the associated gene in the corresponding tissue.

CRE configuration in the NR and RPE domains.

a Schematic representation of the functional relationship between DOCRs, either activating (green) or repressing (red), and their associated DEGs. b The graph illustrates the correlation between the levels of differentially expressed TFs (log2FC) and the accessibility of their associated DOCRs (log2). c The table summarizes the number of activating or repressing CREs associated with either all the DEGs or only with the differentially expressed TFs. d, e Histograms correlating the number of TFs associated with activating or repressing CREs to the number of peaks per gene, for both the NR (d) and RPE (e) domains.

Hierarchical clustering of TFs gene expression variations during optic cup development.

a Hierarchical clustering output shows TFs expression trends in the distinct domains and stages. Gene expression values, normalized by row, are indicated with a red to blue graded color. Note that most clusters comprise a particular domain and developmental stage. b Relative transcript level changes for significant TFs (n) within each cluster.

NR motif enrichment analysis.

a Representative TF binding motifs enriched in NR DOCRs as identified by HOMER. The binding motif similarity among neural retina TFs of the homeobox family is indicated (http://jaspar.genereg.net). b Circoplot illustrating the co-occupancy rate of TFBS in the same DOCRs for the main TFs identified in the motif enrichment analysis. c Circoplot illustrating the degree of co-regulation between TFs regulating the same gene through different DOCRs. d Number of CREs containing the main TFs identified in the motif enrichment analysis classified according to their co-occupancy. e Number of genes associated with CREs containing the main TFs identified in the motif enrichment analysis, classified according to their co-regulation.

RPE motif enrichment analysis.

a Representative TF binding motifs enriched in RPE DOCRs as identified by HOMER. Analysis of the binding motif similarity among TFs of the bHLH family (http://jaspar.genereg.net). b Circoplot illustrating the co-occupancy rate of TFBS in the same DOCRs for the main TFs identified in the motif enrichment analysis. c Circoplot illustrating the degree of co-regulation between TFs regulating the same gene through different DOCRs. d Average percentage of co-occupancy in the same DOCR for two different TF in the RPE and NR. e Average percentage of two different TF regulating the same gene through different DOCRs in the RPE and NR.

Motif enrichment analysis of activating and repressing CREs.

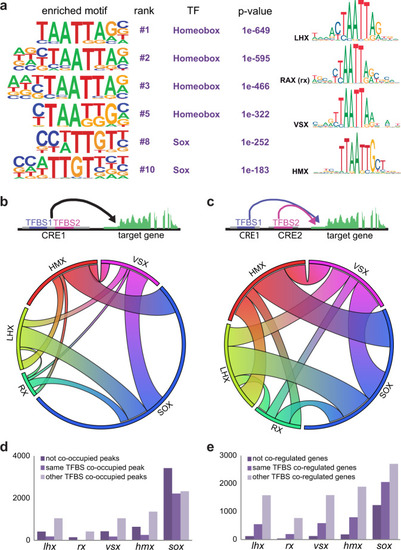
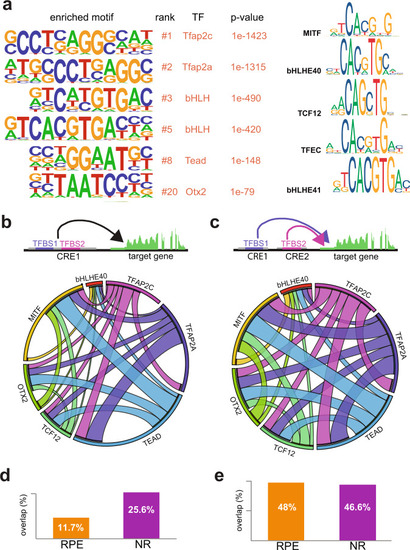
Representative TF motifs enriched in activating (left column) and repressing (right column) CREs in both the NR and RPE domains. Analysis of GO terms enrichment for genes associated with each set of elements is indicated.
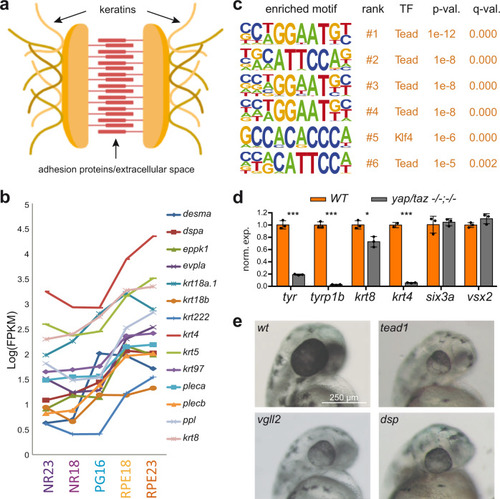
Regulation of desmosomal components during RPE specification.

a Schematic representation of a desmosome junction. b Intermediate filament and desmosomal gene expression variations during optic cup development. Expression values are reported as log(FPKM). c Motif enrichment analysis of the DOCRs associated with genes encoding intermediate filament or desmosome components. d mRNA levels of keratin genes as well as RPE and NR markers as determined by RT-qPCR in wild type and yap −/− taz −/− double mutant zebrafish samples (dissected heads) at 18 hpf. Significant differences are indicated (n = 3; Two-tailed T-test; ***=p < 0.001; *=p < 0,05. p values: tyr = 3.4e−5; tyrp1b = 6e-6; krt8 = 1.2e−2; krt4 = 3.1e−5; six3a = 0.67; vsx2 = 0.12). Data are presented as mean ± SD. Source data are provided as a Source Data file. e Representative stereo microscope images of zebrafish embryo heads at 48 hpf: wild type and embryos injected with Cas9 (300 ng/μl) together with the following sgRNAs (80 ng/μl) combinations: vgll2a and vgll2b (vgll2); tead1a and tead1b (tead1) and dspa and dspb (dsp). Magnification Bar = 250µm. The same magnification was used for each image in the series. Note the reduced eye size and RPE hypopigmentation in the crispants. Injections were repeated twice with similar results. See also Supplementary Fig. 9.

Optic cup architecture and size quantification in candidate gene crispant embryos.

ao Representative optical sections through the optic cup of crispant 24 hpf embryos. Phalloidin/DAPI staining reveals tissue organization of control embryos injected only with Cas9 (a), with sgRNAs directed against rx3 (b), or with sgRNAs for the different candidate genes (indicated in (c)–(o)). Note that, in contrast to rx3 crispant embryos, the optic cup is formed in all cases. However, quantitative analysis of eye area (p) reveals a significant reduction of optic cup size for all candidates tested with the exception of nr2f1. Individual values (n = 10) are plotted in front of standard box-and-whiskers (Two-tailed T-test); ***=p < 0.001, ****=p < 0.0001. p values: cas9 = 0.161; rx3 = 1.15e−6; crh1a = 8.67e−5; dsp = 1.82e−4; mcm2 = 3.09e−5; mif = 1.05e-9; neurod4 = 9.00e−8; nop58 = 8.09e−6; nr2f1 = 0.053; smad6b = 2.25e−4; tcf12 = 2.71e−9; tead1 = 1.62e−6; tead1 + 3 = 1.15e−6; vgll2 = 9.15e−7; wdr12 = 5.00e−4. Abnormal morphology of the RPE cells (m,n) is indicated (red arrowheads). ov optic vesicle, lv lens vesicle. Bar = 50 µm. Source data are provided as a Source Data file. See also Supplementary Figs. 9 and 10.

Gene expression during hiPSCs-to-RPE differentiation.

a Bright field microscopy images (10× and 20×) of hiPSCs before (Day 0) and during their differentiation towards RPE. Note the progressive acquisition of epithelial morphology and pigmentation (observed in three independent experiments). b Hierarchical clustered heatmap showing gene expression level variations, as determined by RT-qPCR during the differentiation towards RPE from hiPSCs. Note the conservation of the two clusters (early and late transcriptional waves) identified in zebrafish.

Acknowledgments
This image is the copyrighted work of the attributed author or publisher, and ZFIN has permission only to display this image to its users. Additional permissions should be obtained from the applicable author or publisher of the image. Full text @ Nat. Commun.