IMAGE

Fig. 2

ID
ZDB-IMAGE-210712-20
Source
Figures for Buono et al., 2021
Image
Figure Caption

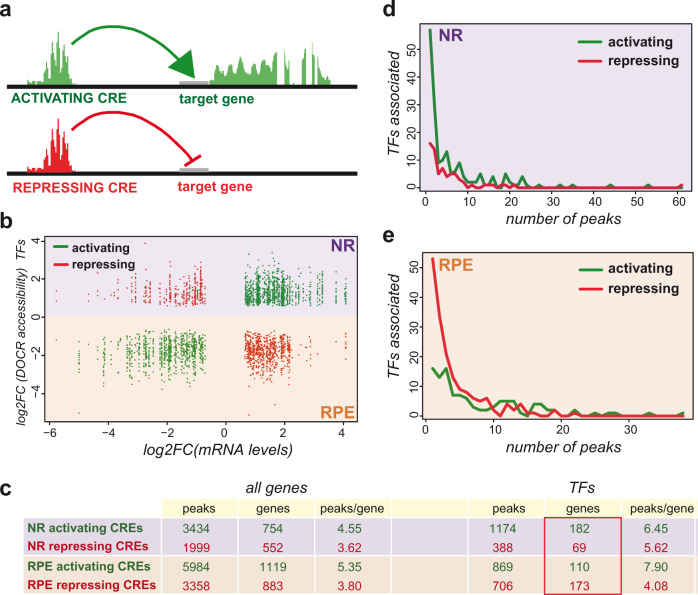
Fig. 2 CRE configuration in the NR and RPE domains.

a Schematic representation of the functional relationship between DOCRs, either activating (green) or repressing (red), and their associated DEGs. b The graph illustrates the correlation between the levels of differentially expressed TFs (log2FC) and the accessibility of their associated DOCRs (log2). c The table summarizes the number of activating or repressing CREs associated with either all the DEGs or only with the differentially expressed TFs. d, e Histograms correlating the number of TFs associated with activating or repressing CREs to the number of peaks per gene, for both the NR (d) and RPE (e) domains.

Acknowledgments
This image is the copyrighted work of the attributed author or publisher, and ZFIN has permission only to display this image to its users. Additional permissions should be obtained from the applicable author or publisher of the image. Full text @ Nat. Commun.