|
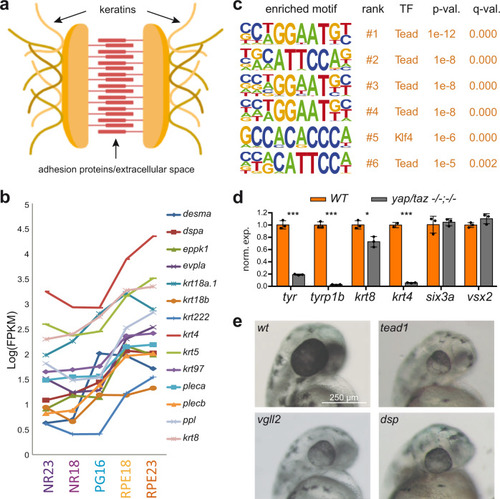
Regulation of desmosomal components during RPE specification.a Schematic representation of a desmosome junction. b Intermediate filament and desmosomal gene expression variations during optic cup development. Expression values are reported as log(FPKM). c Motif enrichment analysis of the DOCRs associated with genes encoding intermediate filament or desmosome components. d mRNA levels of keratin genes as well as RPE and NR markers as determined by RT-qPCR in wild type and yap −/− taz −/− double mutant zebrafish samples (dissected heads) at 18 hpf. Significant differences are indicated (n = 3; Two-tailed T-test; ***=p < 0.001; *=p < 0,05. p values: tyr = 3.4e−5; tyrp1b = 6e-6; krt8 = 1.2e−2; krt4 = 3.1e−5; six3a = 0.67; vsx2 = 0.12). Data are presented as mean ± SD. Source data are provided as a Source Data file. e Representative stereo microscope images of zebrafish embryo heads at 48 hpf: wild type and embryos injected with Cas9 (300 ng/μl) together with the following sgRNAs (80 ng/μl) combinations: vgll2a and vgll2b (vgll2); tead1a and tead1b (tead1) and dspa and dspb (dsp). Magnification Bar = 250 µm. The same magnification was used for each image in the series. Note the reduced eye size and RPE hypopigmentation in the crispants. Injections were repeated twice with similar results. See also Supplementary Fig. 9.
|