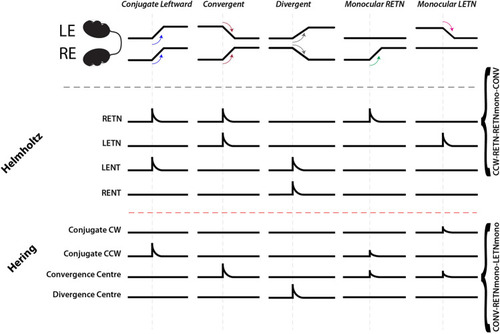
Schematic illustrating the burst neuron populations expected for neurons conforming to either the Hering or Helmholtz hypothesis, and their activity patterns. The descriptors along the right margin indicate how RETN neurons (Helmholtz) and Convergence Centre neurons (Hering) would be classified following our analysis (cf. Table S1). RE/LE right eye/left eye; TN temporal-nasal, NT nasal-temporal.

Measurement of cellular calcium signals during quick eye movements. (a) Schematic of the experimental setup. Visually evoked eye movements (image of the eyes in the lower left) and cellular GCaMP calcium signals (optical slice of the hindbrain in the upper right) were recorded in agarose-embedded zebrafish larvae. A black foil in front of the area of binocular overlap enabled independent stimulation of the two eyes with differing stimulus speeds. (b) Example of various horizontal saccade types: monocular, clockwise (CW), convergent (CONV) and divergent (DIV) saccades. The left eye (LE) is shown in magenta, and the right eye (RE) in green. Positive eye positions refer to rightward eye positions. (c) The stimulus protocol consisted of two unbalanced monocular phases, a rotation phase, and finally a translation phase. For each phase, the presented stimulus velocities and directions for the two eyes are illustrated by the size and color of the arrows. During unbalanced stimulation, the absolute stimulus speed was different for the left and the right eyes. For rotation and translation, the absolute speed was the same for the two eyes. (d) Example eye positions and saccadic velocities during stimulation are shown in the top four rows. Only saccadic velocities were of interested for this study and therefore slow-phase velocities were not analyzed here (see “Methods”). Note that we paused stimulus motion after each detected saccade (grey shaded area in the stimulus protocol trace) to decorrelate oculomotor position and velocity signals (see “Methods”). Due to the differential stimulation of the left and the right eye, the eye movements were partially unyoked during unbalanced monocular and translation stimulation (see eye velocity difference trace, LE-RE). The calcium activity (orange) of two example neurons is shown in the lower two traces. One neuron is active during CW saccades (CW velocity regressor in light blue), and the other neuron is coding for rightward eye positions (eye position regressor in light blue). The magnified insets at the bottom allow an easier comparison of activity onset relative to eye position change. Though position neurons can be active at saccadic timepoints (e.g. in the right inset), our saccade-related neurons consistently show their highest calcium fluorescence directly after the saccade.

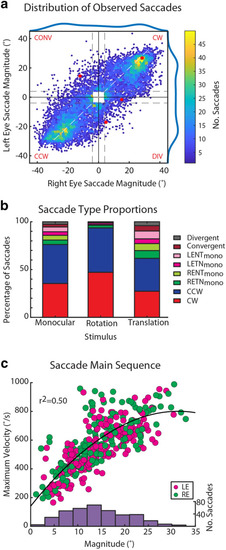
Characterization of binocular saccades. (a) Heat scatter plot48 showing the distribution of binocular optokinetic saccade magnitudes in all analyzed calcium imaging experiments (n = 30 larvae, 146 recordings, 9,866 data points). The saccades shown in Fig. 2b are plotted in red. Only saccades larger than 4° were included in further analysis for technical reasons. The classification thresholds for monocular, clockwise (CW), counter-clockwise (CCW), convergent (CONV) and divergent (DIV) are indicated as dashed grey lines, and the outer quadrants are labelled in red. (b) Proportion of saccade types per protocol phase. Note that the translation and unbalanced monocular stimulus phases elicited higher proportions of disconjugate saccades than the rotation phase. (c) Dependence of maximum saccade velocity on saccade magnitude (main sequence). Spontaneous clockwise saccades of both eyes (LE, RE) were recorded at 750 fps (n = 24 zebrafish larvae). A histogram of saccadic velocities is shown in brown on top. The distribution was fitted using a cubic polynomial with a resulting R2 value of 0.5. LETN left eye temporal nasal; RENT right eye nasal temporal; LENT left eye nasal temporal; RETN right eye temporal nasal; mono: monocular saccade.

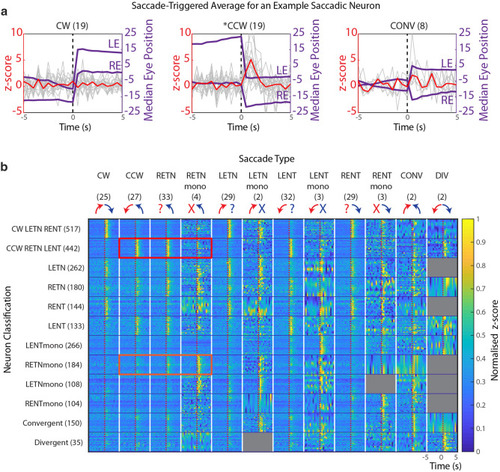
Peri-saccadic activity of different saccade-associated neuron types. (a) Saccade-triggered average (STA) of neural activity (calcium signal z-score, red trace). The example neuron was significantly active during or directly after CCW saccades (middle) but inactive during CW or CONV saccades (left and right plots), the full STA for this neuron is shown in Fig. S2. The numbers in brackets indicate the number of saccades in this recording. Median eye positions are plotted in purple. Z-score traces for individual saccades are plotted in grey. The dotted line represents the saccade time point. Saccade-associated neurons were first identified via regressor based analysis, and then classified based on a ranksum test comparing activity in the 9 pre-saccadic sampled time points with that of the saccadic, and two immediate post-saccadic timepoints. Resulting values were Bonferroni corrected (factor of 3). (b) Raster plot of neuronal STA activity (normalized per neuron) across different saccades types (columns) and for different neuron types (rows). Neurons were classified according to the STA significance analysis (see “Methods”) and the numbers of identified neurons for each classified neuron type are indicated in brackets. Note that the conjugate CCW-RETN-LENT population is not significantly active during monocular RETN saccades (red rectangle), and the RETNmono population is not significantly active during conjugate CCW saccades (orange rectangle). Within a functional neuron type, each line represents the activity of a single cell. Since certain neuron types occurred less frequently than others, the y-axis has been compressed or stretched to fill each of the squares for visualization purposes. X-axis labels indicate the saccade type, and mean number of saccades of that type occurring per recording. Grey squares correspond to neuron and saccade type combinations for which we had an insufficient amount of data (less than two neurons in the population with 6 saccades of that type).

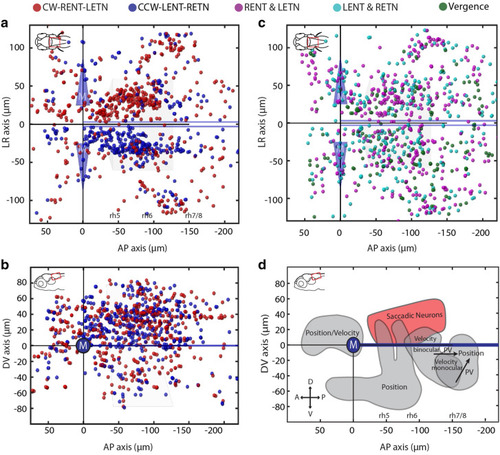
Anatomical distribution of putative burst neurons in the zebrafish hindbrain. Each colored ball represents an identified saccade-associated neuron. (a,b) Dorsal and sagittal cell maps for CW-LETN-RENT and CCW-LENT-RETN neurons. (c) Dorsal cell map for pooled Helmholtz-like neurons representing clockwise (RENT type and LETN type) and counter-clockwise (RETN type and LENT type) directions, as well as vergence (convergent, divergent) neurons. (d) Sagittal schematic illustrating the position of the major cluster of SA neurons (red) relative to the position of other neuron types (grey) identified in a previous study (adapted from Brysch, Leyden and Arrenberg16, licensed under CC BY 4.0 (http://creativecommons.org/licenses/by/4.0/)). In (ac), the trapezoid box represents the abducens nucleus, and the blue cones represent the Mauthner (M) cell bodies. The medial longitudinal fasciculus is represented by the thick blue lines parallel to the larval midline. D dorsal; V ventral; A anterior; P posterior; DV dorsal–ventral; AP anterior–posterior. Data from n = 30 larvae is merged in the anatomical plots (ac), corresponding to approximately 3.5–7 completely imaged hindbrains in the range of − 80 to 40 µm (see “Methods”).

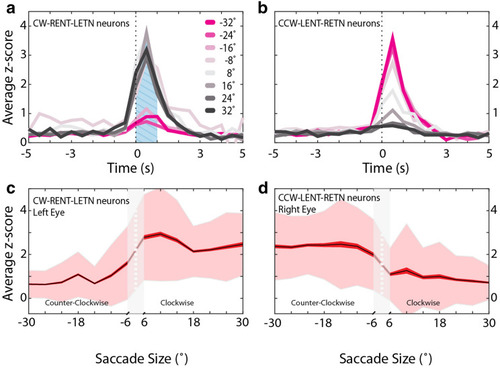
SA neuron tuning to saccade size. (a,b) Peri-saccadic activity (calcium z-score) of the two major neuron types encoding conjugate saccades, i.e. neuron types CW-LETN-RENT in (a) and CCW-LENT-RETN in (b). Activity traces have been stratified according to average binocular saccade size in 8° bins (see color legend). The blue hatched area in (a) indicate the z-score time points used for the analysis in (c,d). (c,d) Separate saccade size tuning curves for the left eye CW (c) and right eye CCW (d) neurons. Saccade sizes are binned in 4° steps. The black graphs indicate the average z-scores, while red and faint red envelopes indicate the standard error of the mean and the standard deviation, respectively.

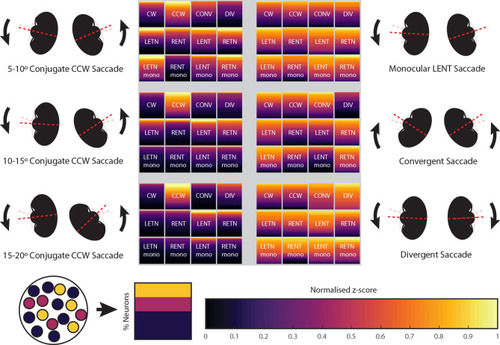
Summary of observed hindbrain saccade-associated activity across different saccade types. Each square refers to the population of neurons listed, except in the case of CW and CCW which refer to CW-LETN-RENT and CCW-LENT-RETN type neurons (see Fig. 4b). For each neuron population and saccade type, the percentage of active neurons and their levels of activity are illustrated by the covered area within the square and the color distribution, respectively (see color legend). The activity of the 12 neuron types is plotted for six different saccade types. Note that many populations are active during small saccades (5°–10° conjugate CCW), even neurons with opposing directional selectivity (e.g. LETN and LENT). However, for large saccades (15°–20° conjugate CCW) mainly the CCW-LENT-RETN population is active, which supports a push–pull encoding of saccade size. CW clockwise; CCW counter-clockwise; CONV convergent; DIV divergent; LE left eye; RE right eye; NT nasal-temporal; TN temporal-nasal; mono monocular eye movements.

Acknowledgments
This image is the copyrighted work of the attributed author or publisher, and ZFIN has permission only to display this image to its users. Additional permissions should be obtained from the applicable author or publisher of the image. Full text @ Sci. Rep.