FIGURE

Figure 5

ID
ZDB-FIG-210625-11
Publication
Leyden et al., 2021 - A distributed saccade-associated network encodes high velocity conjugate and monocular eye movements in the zebrafish hindbrain
Other Figures
All Figure Page
Back to All Figure Page
Figure 5

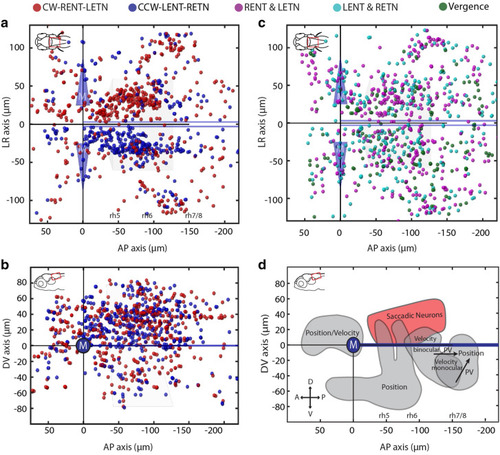
Anatomical distribution of putative burst neurons in the zebrafish hindbrain. Each colored ball represents an identified saccade-associated neuron. (a,b) Dorsal and sagittal cell maps for CW-LETN-RENT and CCW-LENT-RETN neurons. (c) Dorsal cell map for pooled Helmholtz-like neurons representing clockwise (RENT type and LETN type) and counter-clockwise (RETN type and LENT type) directions, as well as vergence (convergent, divergent) neurons. (d) Sagittal schematic illustrating the position of the major cluster of SA neurons (red) relative to the position of other neuron types (grey) identified in a previous study (adapted from Brysch, Leyden and Arrenberg16, licensed under CC BY 4.0 (http://creativecommons.org/licenses/by/4.0/)). In (ac), the trapezoid box represents the abducens nucleus, and the blue cones represent the Mauthner (M) cell bodies. The medial longitudinal fasciculus is represented by the thick blue lines parallel to the larval midline. D dorsal; V ventral; A anterior; P posterior; DV dorsal–ventral; AP anterior–posterior. Data from n = 30 larvae is merged in the anatomical plots (ac), corresponding to approximately 3.5–7 completely imaged hindbrains in the range of − 80 to 40 µm (see “Methods”).

Expression Data

Expression Detail
Antibody Labeling
Phenotype Data

Phenotype Detail
Acknowledgments
This image is the copyrighted work of the attributed author or publisher, and ZFIN has permission only to display this image to its users. Additional permissions should be obtained from the applicable author or publisher of the image. Full text @ Sci. Rep.