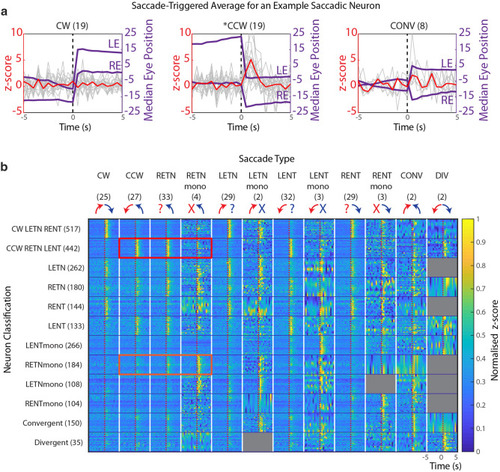
Peri-saccadic activity of different saccade-associated neuron types. (a) Saccade-triggered average (STA) of neural activity (calcium signal z-score, red trace). The example neuron was significantly active during or directly after CCW saccades (middle) but inactive during CW or CONV saccades (left and right plots), the full STA for this neuron is shown in Fig. S2. The numbers in brackets indicate the number of saccades in this recording. Median eye positions are plotted in purple. Z-score traces for individual saccades are plotted in grey. The dotted line represents the saccade time point. Saccade-associated neurons were first identified via regressor based analysis, and then classified based on a ranksum test comparing activity in the 9 pre-saccadic sampled time points with that of the saccadic, and two immediate post-saccadic timepoints. Resulting values were Bonferroni corrected (factor of 3). (b) Raster plot of neuronal STA activity (normalized per neuron) across different saccades types (columns) and for different neuron types (rows). Neurons were classified according to the STA significance analysis (see “Methods”) and the numbers of identified neurons for each classified neuron type are indicated in brackets. Note that the conjugate CCW-RETN-LENT population is not significantly active during monocular RETN saccades (red rectangle), and the RETNmono population is not significantly active during conjugate CCW saccades (orange rectangle). Within a functional neuron type, each line represents the activity of a single cell. Since certain neuron types occurred less frequently than others, the y-axis has been compressed or stretched to fill each of the squares for visualization purposes. X-axis labels indicate the saccade type, and mean number of saccades of that type occurring per recording. Grey squares correspond to neuron and saccade type combinations for which we had an insufficient amount of data (less than two neurons in the population with 6 saccades of that type).
|
