
- Title
-
Basal epidermis collective migration and local sonic hedgehog signaling promote skeletal branching morphogenesis in zebrafish fins
- Authors
- Braunstein, J.A., Robbins, A.E., Stewart, S., Stankunas, K.
- Source
- Full text @ Dev. Biol.
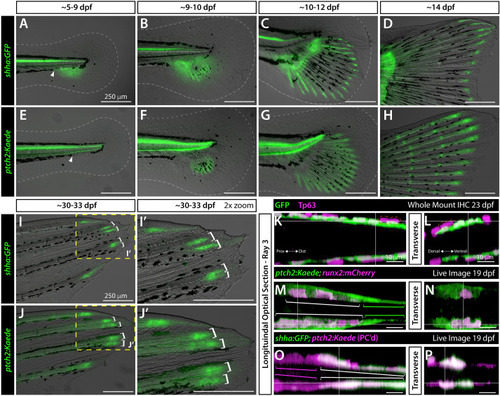
Basal epidermal shha and ptch2-defined responses in basal epidermis and pre-osteoblasts become progressively distally restricted during caudal fin development. (A-J’) Differential interference contrast and fluorescent overlay images of developing caudal fins of shha:GFP (A-D, I, I’) and ptch2:Kaede (E-H, J, J’) fish of indicated ages. White dotted lines outline the fin fold (A–F). The white arrowhead indicates the gap in melanophores where shha:GFP expression emerges. Yellow boxes in (I, J) indicate the 2x zoom fields in (I’, J’). White brackets (I-J’) mark branched reporter domains in dorsal rays 2 and 3 preceding overt ray branching. (K–P) Single optical slices of caudal fin dorsal ray 3 in longitudinal (K, M,O) and transverse (L, N, P) planes derived from 3D-reconstructed whole mount confocal images of fluorescent reporter fish of indicated ages. (K, L) 23 dpf shha:GFP fin whole mount antibody stained for GFP (green) and the basal epidermis marker Tp63 (magenta). The orange dashed line outlines a representative Tp63+, GFP- cell that occasionally overlay the innermost basal epidermal layer. (M–P) Single optical slice reconstructed equivalents from live whole mount-imaged 19 dpf ptch2:Kaede;runx2:mCherry and shha:GFP;ptch2:Kaede caudal fins. (M, N) ptch2:Kaede (green) is in distal runx2-marked pre-osteoblasts (magenta; white brackets) and a thin layer of tightly associated adjacent and further distally-extending basal epidermis (green brackets). (O, P) ptch2:Kaede (photoconverted; magenta) in pre-osteoblasts (magenta brackets) and co-localized with shha:GFP-expressing basal epidermis (green, white brackets). Scale bars are 250 μm in (A-J’) and 10 μm in (K–P). |
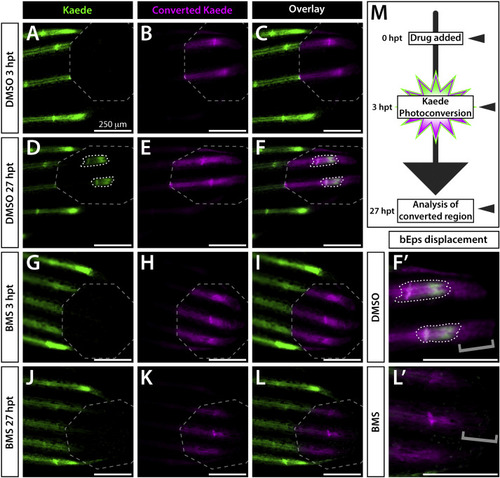
Active Shh/Smo signaling is restricted to a narrow distal stretch of each developing fin ray. (A–L) Whole mount fluorescence images of the distal aspect of the caudal fin of 25 dpf ptch2:Kaede fish treated with DMSO (A–F) or BMS-833923 (BMS; G-L). Images are from the time of Kaede photoconversion from green to red (false colored magenta) fluorescence (3 h post treatment (hpt); A-C, G-I) and 24 h later (27 hpt, D-F, J-L). Grey dashed octagons mark photoconverted regions of interest (ROIs). The 3 hpt overlay (C) demonstrates complete Kaede photoconversion. The same fish at 27 hpt displays a small patch of newly produced green Kaede (white dotted outlines in D, F) within the ROI. Slight splitting of the new green Kaede domain indicates the onset of ray branching. The BMS-treated fish shows no new Kaede within the ROI (J–L). (F’, L’) Zoom view of distal ray regions. Grey brackets mark presence or absence of distally displaced basal epidermis retaining photoconverted Kaede. The few green Kaede+basal epidermal cells in (J, L) moved into the photoconverted region without producing new Kaede. (M) Schematic of the time course for drug treatment, photoconversion, and imaging. Imaged fish represent groups of n = 8. Scale bars are 250 μm. |
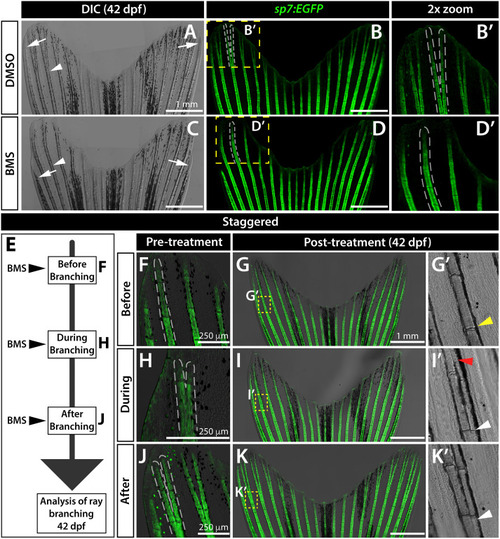
Sustained Shh/Smo signaling is required for ray branching in developing caudal fins. (A–D) Differential interference contrast (DIC) and fluorescence images of caudal fins from DMSO (A, B) and BMS-833923 (BMS)-treated (C, D) 42 dp f sp7:EGFP osteoblast reporter fish. Dashed white lines outline dorsal ray 3 and daughter rays, when present. White arrowheads designate a present (A) or absent (B) branch point. White arrows mark ends of the principal peripheral rays. (E–K) Experimental schematic of (E) and resulting caudal fin images of 42 dpf sp7:EGFP fish from (F–K’) staggering the start of BMS treatment to before (F-G’), during (H–I’), and after branch initiation (J-K’). Yellow dashed boxes outline dorsal ray 2 regions shown in (G’, I’ and K’). The yellow arrowhead in (G’) designates where branching would have occurred without Shh/Smo-inhibition. The red arrowhead in (I’) marks where a ray re-fused when BMS was added after branching had initiated. White arrowheads in (I’ and K’) indicate ray branch points. Images represent treatment groups (before, during, and after) of n=4 or 5 BMS-treated and n = 2 or 3 DMSO controls. Ray re-fusions occur in 4 of 5 fish treated with BMS “during” ray branching in rays 2, 3, and 16. Scale bars are 250 μm or 1 mm, as indicated. |
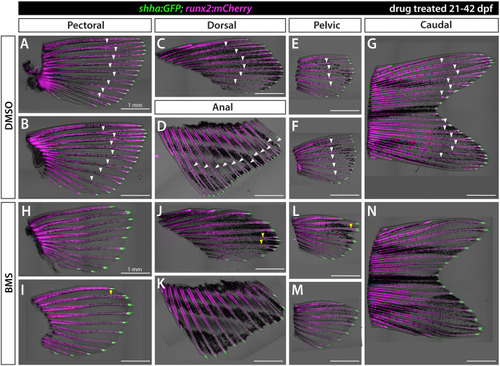
Shh/Smo signaling promotes ray branching in all paired and unpaired fins. Brightfield and fluorescence overlay images of isolated fins from shha:GFP;runx2:mCherry juvenile fish treated with DMSO (A–G) or 1.25 μM BMS-822923 (BMS; H–N) from 21 to 42 dpf. runx2:mCherry-labeled rays branch (white arrowheads) in all fins whereas rays of BMS-treated fish mostly fail to branch or have severely delayed branching (yellow arrowheads). shha:GFP+basal epidermal cells are restricted to distal ray tips under both conditions. n=6 for each group. Scale bars are 1 mm. |
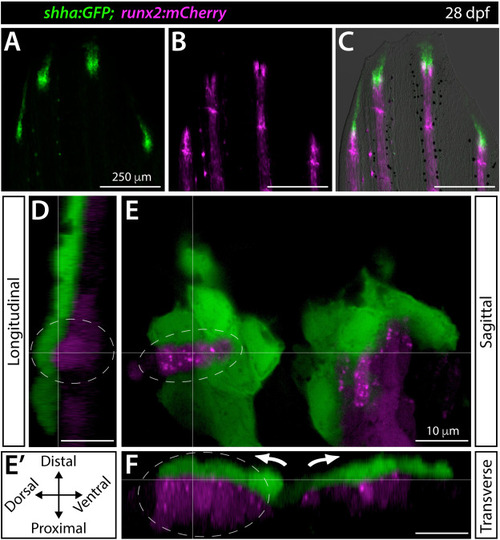
Shha+basal epidermis and pre-osteoblasts are intertwined in developing fins. (A–F) Fluorescence widefield (A–C) or confocal (D–F) images of the dorsal caudal fin lobe of a 28 dpf shha:GFP;runx2:mCherry fish. (A–C) shha:GFP-expressing basal epidermal cells (green) overlay and extend distally from runx:mCherry-high pre-osteoblast (magenta). The overlay in (C) includes a brightfield image for context. (D–F) A single optical slice (E; sagittal; orientation key in E’) and reconstructed longitudinal (D) and transverse (F) views of a distal ray region undergoing ray branching. shha:GFP+basal epidermis (green) and runx2:mCherry+pre-osteoblasts (magenta) have overlapping signal at interfaces, indicating their tight juxtaposition. Basal epidermis and pre-osteoblasts tandemly separate into split pools during branching (white arrows). The grey dotted oval highlights a ridge of pre-osteoblasts nestled into a shha:GFP+basal epidermal groove (Movie 2). Scale bars are 250 μm (A–C) and 10 μm (D–F). |
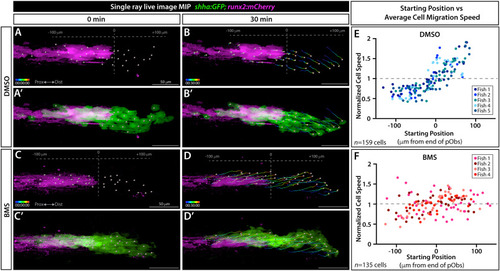
Shh/Smo signaling slows collective migration of shha-expressing basal epidermal cells associated with pre-osteoblasts. (A-D’) Frames from a time lapse movie showing dorsal ray 3 of the caudal fin from live mounted 24 dpf shha:GFP;runx2:mCherry fish treated with DMSO or BMS-833923 (BMS) for 24 h prior to imaging. Images are maximum intensity projections (MIP) and show the start (0 min; A, A’, C, C’) and end (30 min; B, B’, D, D’) points. The Imaris-generated colored tracks show the progressive displacement of individual shha:GFP+basal epidermal cells (green). Grey spheres show the starting or final positions of all tracked basal epidermal cells. Grey dashed vertical lines in (A, B, C, D) indicate the distal most Runx2+ pre-osteoblast (magenta), defined as position “0”. (E, F) Scatter plot graphs showing the average speed of individual basal epidermal cells, considering their net X-displacement and normalized to all scored cells of the given fish, relative to starting position for DMSO- (159 individual cells from five fish) and BMS-exposed fish (135 cells from four fish). Dot colors correspond to cells from a given fish. Scale bars are 50 μm. |
Reprinted from Developmental Biology, 477, Braunstein, J.A., Robbins, A.E., Stewart, S., Stankunas, K., Basal epidermis collective migration and local sonic hedgehog signaling promote skeletal branching morphogenesis in zebrafish fins, 177-190, Copyright (2021) with permission from Elsevier. Full text @ Dev. Biol.