- Title
-
Truncation of the otoferlin transmembrane domain alters the development of hair cells and reduces membrane docking
- Authors
- Manchanda, A., Bonventre, J.A., Bugel, S.M., Chatterjee, P., Tanguay, R., Johnson, C.P.
- Source
- Full text @ Mol. Biol. Cell
|
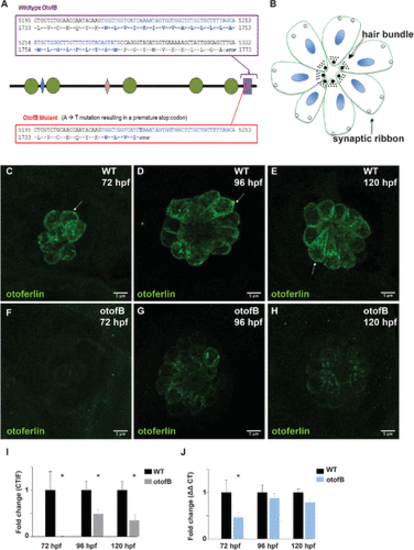
The otofb mutation results in reduced otoferlin expression. (A) Schematic of the otofB mutation. Green circles denote C2 domains and blue and pink diamonds denote FerI and FerB domains, respectively. Purple rectangle denotes the TMD. (B) Diagram of a neuromast in the same top-down orientation as the images in panels C–H. (C–E) Representative confocal images of 72 hpf (C), 96 hpf (D), and 120 hpf (E) WT neuromasts stained for otoferlin. Arrows denote the basolateral end of a sensory hair cell. (F–H) Representative confocal images of 72 hpf (F), 96 hpf (G), and 120 hpf (H) mutant neuromasts stained for otoferlin. (I) Quantification of otoferlin in WT and otofB neuromasts (t test, p < 0.001). N = 4 larvae, 4 neuromasts per larvae for both WT and mutant. (J) Quantification of otoferlin mRNA in wild-type and otofb larvae (t test, p < 0.001). N = 4 for both wild type and mutant. Scale bars = 5 µm EXPRESSION / LABELING:
PHENOTYPE:
|
|
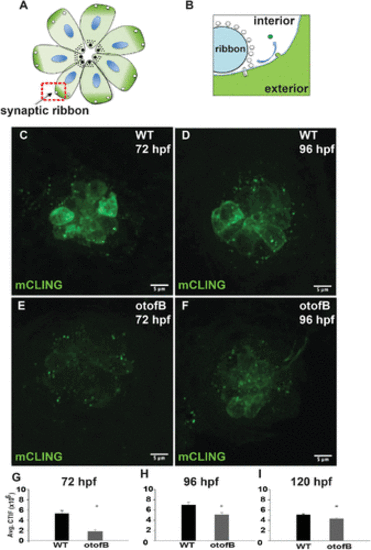
The otofB mutation results in reduced mCLING uptake. (A) Diagram of a neuromast in the same top-down orientation as the images in panels C–F. (B) Magnified view of a ribbon synapse highlighted in red in panel A. Endocytosis results in mCLING incorporation from the cell exterior into the vesicle lumen (green). (C, D) Representative confocal images of (C) 72 hpf and (D) 96 hpf mCLING-stained wild-type lateral line neuromasts. (E, F) Representative confocal images of (E) 72 hpf and (F) 96 hpf mCLING-stained mutant lateral line neuromasts. (G) Quantification of average mCLING dye associated with 72 hpf neuromasts of wild-type and otofB zebrafish (t test, p < 0.001). (H) Quantification of average mCLING dye associated with 96 hpf neuromasts of wild-type and otofB zebrafish (t test, p < 0.001). N = 6 larvae, 4 neuromasts per larvae for both wild type and mutant. Scale bars = 5 µm. (I) Quantification of average mCLING dye associated with 120 hpf neuromasts of wild-type and otofB zebrafish (t test, p < 0.001). N = 4 WT larvae, 3 mutant larvae, 4 neuromasts per larvae. Scale bars = 5 µm. PHENOTYPE:
|
|
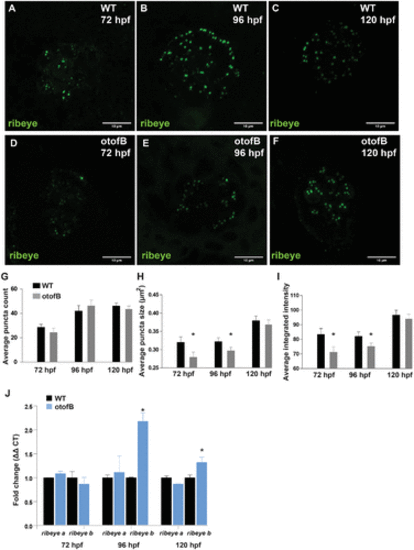
The otofB mutation results in reduced expression of Ribeye in neuromasts. (A–C) Representative confocal images of 72 hpf (A), 96 hpf (B), and 120 hpf (C) wild-type neuromasts stained for Ribeye. (D–F) Representative confocal images of 72 hpf (D), hpf 96 (E), and 120 hpf (F) mutant neuromasts stained for Ribeye. (G) Average puncta count in Ribeye-stained wild-type and otofB neuromasts (t test, p < 0.001). N = 4 WT and 6 mutant larvae, 4 neuromasts per larvae for both WT and mutant. (H) Average Ribeye puncta sizes in μm2 for wild-type and otofB mutant neuromasts. (I) Average integrated intensity of Ribeye puncta for wild-type and otofB mutant neuromasts. (J) Quantification of Ribeye a and Ribeye b mRNA transcript expression at 72, 96, and 120 hpf in WT and otofB mutant larvae (t test, p < 0.001). N = 4 for both wild type and mutant. Scale bars = 5 µm. EXPRESSION / LABELING:
PHENOTYPE:
|
|
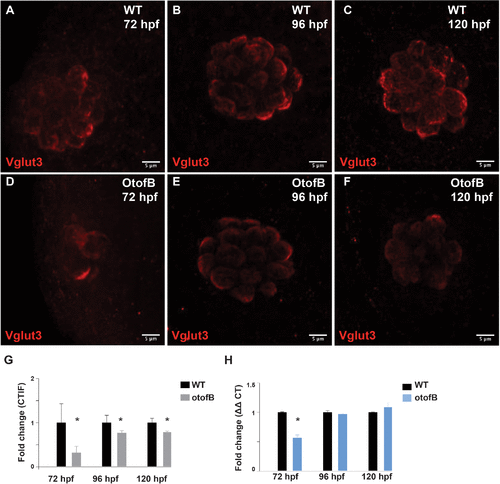
The otofB mutation results in reduced Vglut3 in neuromasts. (A–C) Representative confocal images of 72 hpf (A), 96 hpf (B), and 120 hpf (C) WT neuromasts stained for Vglut3. (D–F) Representative confocal images of 72 hpf (D), 96 hpf (E), and 120 hpf (F) mutant neuromasts stained for Vglut3. (G) Quantification of Vglut3 in WT and OtofB neuromasts (t test, p < 0.001). N = 4 larvae, four neuromasts per larvae for both WT and mutant. (H) Quantification of Vglut3 mRNA transcripts in WT and OtofB larvae (t test, p < 0.001). N = 4 for both WT and mutant. Scale bars = 5 µm. EXPRESSION / LABELING:
PHENOTYPE:
|
|
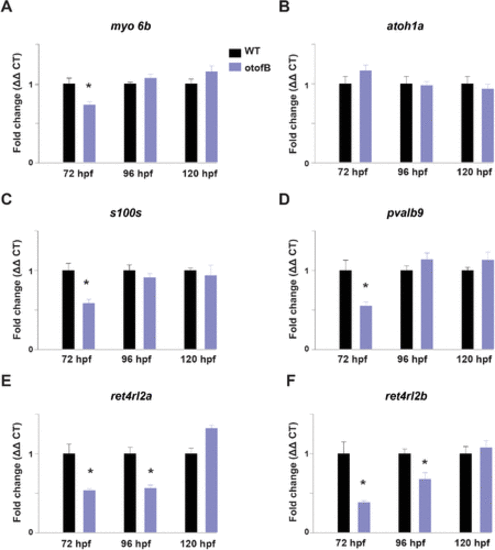
The otofB mutation results in altered expression of hair cell–related transcripts. (A–F) Quantification of mRNA by qRT-PCR for myo6b, atoh1a, s100s, pvalb9, ret4rl2a, ret4rl2b in wild-type and otofB larvae at 72, 96, and 120 hpf. (A) Quantification of myo6b mRNA, (B) quantification of Atoh1a mRNA, (C) quantification of s100s mRNA, (D) quantification of pvalb9 mRNA, (E) quantification of rtn4rl2a mRNA, (F) quantification of rtn4rl2b mRNA in wild-type and otofB larvae at 72, 96, and 120 hpf (t test, p < 0.001). N = 4 for both WT and mutant, with each N as a composite of 20–30 larvae. The data presented are representative of three experimental replicates for each time point. Error bars are SEM. EXPRESSION / LABELING:
PHENOTYPE:
|
|
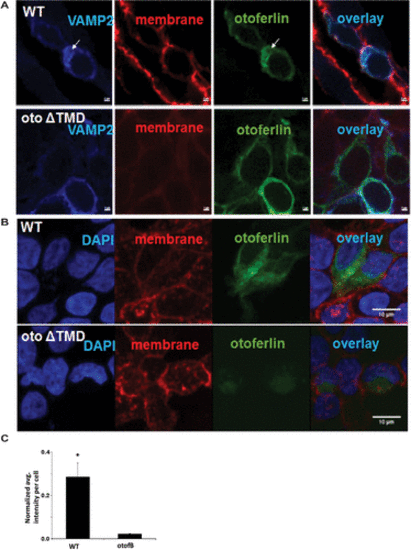
Loss of the TMD reduces expression of otoferlin in cell culture. (A) Representative images of cells transfected with CFP-VAMP and either WT mouse otoferlin or ΔTMD, a mouse otoferlin with a mutation matching the otofB mutation. (B) Representative images of cells labeled with 4′,6-diamidino-2-phenylindole (blue), wheat germ agglutinin for the cell membrane (red), and otoferlin (green). (C) Quantitation of the intensity of otoferlin from transfected HEK cells (t test, p < 0.001). Scale bar for A and B = 2 µm, and 10 µm for C and D. |
|
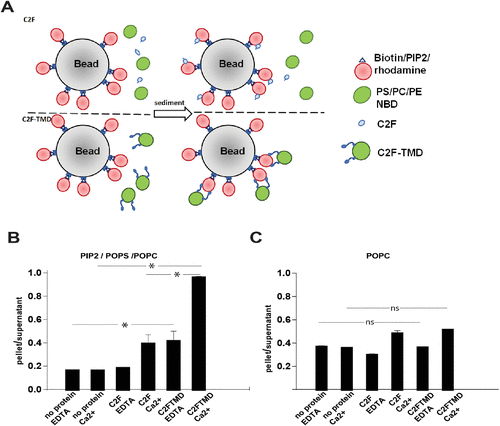
Reconstituted otoferlin docks adjacent liposomes. (A) Diagram of the pull-down system. Rhodamine-labeled liposomes are conjugated to streptavidin beads and mixed with either NBD liposomes and soluble C2F (top) or C2F-TMD proteoliposomes labeled with NBD (bottom). (B) Quantitation of liposome sedimentation assay with bead-conjugated liposomes with PI(4,5)P2 (5:25:60:5:5 PIP2, POPS, POPC, rhodamine-PE, biotin-PE) (t-test, p < 0.001). (C) Quantitation of liposome sedimentation assay with bead-conjugated liposomes without negatively charged lipids (90:5:5 POPC, rhodamine-PE, biotin-PE) (t-test, p < 0.001). N = 4. |
|
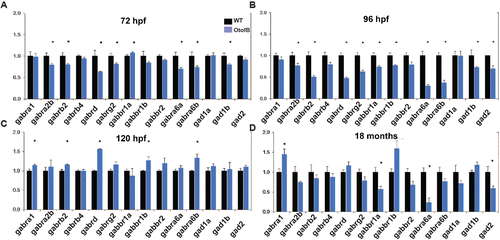
The otofB mutation results in abnormal glutamate decarboxylase and GABA receptor subunit transcripts levels. (A–C) Quantification of mRNA by qRT-PCR for GABA receptor subunits and GAD transcripts in wild-type and otofB larvae at 72, 96, and 120 hpf. N = 4 for both WT and mutant, with each N as a composite of 20–30 larvae. (D) Quantification of mRNA by qRT-PCR for GABA receptor subunit and GAD transcripts in wild-type and otofB adult zebrafish brain (t test, p < 0.001). N = 4 for both WT and mutant, with each N as a composite of 20–30 larvae. The data presented are representative of three experimental replicates for each time point. Error bars are SEM. EXPRESSION / LABELING:
PHENOTYPE:
|
|
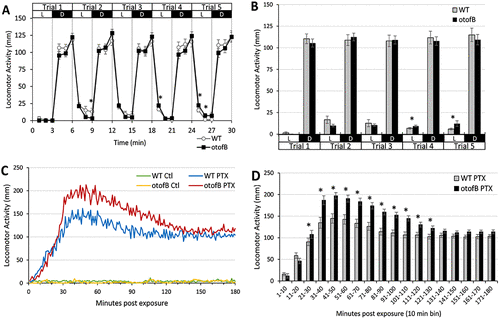
Larval zebrafish behavioral assays for wild-type (WT) and otofB mutants at 4 d postefertilization suggest altered behavior and GABAA receptor function in otofB mutants. (A, B) The larval photomotor response (LPR) assay evaluated locomotor activity in response to repeated photoperiod transitions from light (L) to dark (D), which typically elicits hyperactive responses in the dark phase. Five trials were conducted with 3 min per photoperiod. For the LPR assay, data are shown and statistically analyzed using a time-course plot of average locomotor for (A) each minute, as well as average activity within (B) each 3 min photoperiod. (C, D) The larval chemomotor response (LCR) assay evaluated locomotor activity in response to 100 µM picrotoxin (PTX), a known GABAA receptor antagonist that elicits a robust hyperactive locomotor response in larval zebrafish. Locomotor activity was measured for 3 h immediately following the application of PTX, relative to control (0.1% DMSO). For the LCR assay, average locomotor activity for each minute is plotted across the 3 h timecourse (C), and data were statistically analyzed using average activity within 10 min time bins (D). All data are reported as mean ± SEM. Significance was determined using two-way repeated measures ANOVA with Tukey’s post-hoc, p ≤ 0.05, N = 48 animals per group (4 d postfertilization larval zebrafish). PHENOTYPE:
|

ZFIN is incorporating published figure images and captions as part of an ongoing project. Figures from some publications have not yet been curated, or are not available for display because of copyright restrictions. EXPRESSION / LABELING:
|

ZFIN is incorporating published figure images and captions as part of an ongoing project. Figures from some publications have not yet been curated, or are not available for display because of copyright restrictions. EXPRESSION / LABELING:
PHENOTYPE:
|

