
|
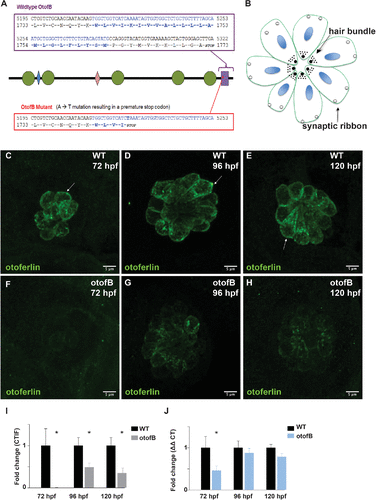
Fig. 1 The otofb mutation results in reduced otoferlin expression. (A) Schematic of the otofB mutation. Green circles denote C2 domains and blue and pink diamonds denote FerI and FerB domains, respectively. Purple rectangle denotes the TMD. (B) Diagram of a neuromast in the same top-down orientation as the images in panels C–H. (C–E) Representative confocal images of 72 hpf (C), 96 hpf (D), and 120 hpf (E) WT neuromasts stained for otoferlin. Arrows denote the basolateral end of a sensory hair cell. (F–H) Representative confocal images of 72 hpf (F), 96 hpf (G), and 120 hpf (H) mutant neuromasts stained for otoferlin. (I) Quantification of otoferlin in WT and otofB neuromasts (t test, p < 0.001). N = 4 larvae, 4 neuromasts per larvae for both WT and mutant. (J) Quantification of otoferlin mRNA in wild-type and otofb larvae (t test, p < 0.001). N = 4 for both wild type and mutant. Scale bars = 5 µm