
- Title
-
BMP Signaling Interferes with Optic Chiasm Formation and Retinal Ganglion Cell Pathfinding in Zebrafish
- Authors
- Knickmeyer, M.D., Mateo, J.L., Heermann, S.
- Source
- Full text @ Int. J. Mol. Sci.

BMP signaling does not disrupt optic nerve head formation but prevents optic chiasm formation. (A–D) In situ hybridization of (A,B) ntn1a and (C,D) pax2a at 30 hpf in tg(hsp70l:bmp4) embryos and controls heat shocked at 15 hpf. DAPI counterstaining, sagittal view, nasal to the left. (E–H) Immunohistochemistry against GFP in tg(pou4f3:mGFP, hsp70l:bmp4) embryos and controls at 4 dpf. (E,F) Control eye, (F) tilted ventral projection. (G,H) Eye of an embryo with bmp4 induced at 15 hpf. RGC axons wrapping around the rim from the everted temporal retinal domain (arrow). (H) Tilted 3D projection of the eye depicted in (G). ONH is intact (asterisk), there is an aberrant nasal branch of the optic nerve (arrowheads). DAPI counterstaining, sagittal view, nasal to the left. (I,J) Live imaging of tg(pou4f3:mGFP, hsp70l:bmp4) embryos and controls at 3 dpf. (M) Control embryo. (N) Transgenic embryo with bmp4 induced at 15 hpf. RGCs project ipsilaterally. The right optic nerve possesses an additional nasal branch (arrowhead). There is no gap within the diencephalon (arrow). Transverse view. (K–O) In situ hybridization of fsta, midline expression (arrows) in the ventral prosencephalon of wild type embryos between 16–24 hpf. DAPI counterstaining, transverse view. All images are maximum intensity projections. Scale bars 50 µm. EXPRESSION / LABELING:
PHENOTYPE:
|
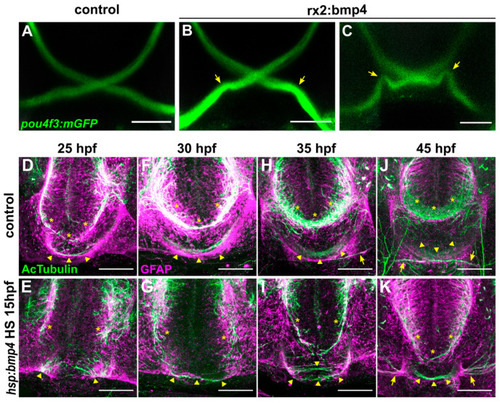
Ubiquitous bmp4 induction, but not eye specific bmp4 expression, results in a midline defect. (A–C) Immunohistochemistry against GFP in (B,C) tg(pou4f3:mGFP, rx2:bmp4) embryos and (A) controls at 4 dpf. Chiasms are intact, but optic nerve trajectories are irregular (arrows). (D–K) Immunohistochemistry against Ac-αTub and GFAP in (E,G,I,K) tg(hsp70l:bmp4) embryos and (D,F,H,J) controls at 25–45 hpf reveals the anterior (asterisks) and post-optic (arrowheads) commissures. Later stages include optic nerves (arrows). All images are maximum intensity projections, transverse view, scale bars 50 µm. |
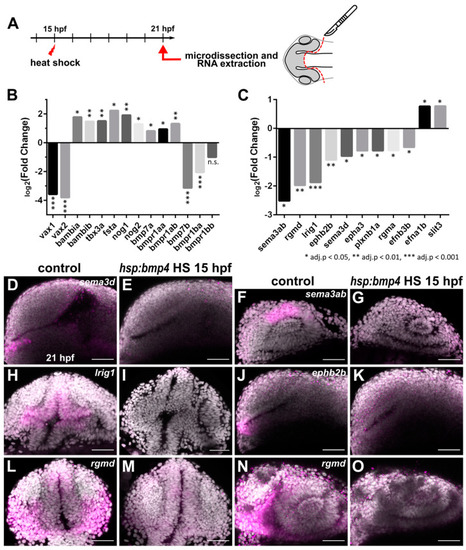
Transcriptomic analysis of forebrain tissue after bmp4 overexpression reveals differential regulation of several axon guidance factors. (A) Scheme of sample collection for transcriptome analysis. (B,C) Expression changes of selected genes related to (B) optic cup patterning and BMP signaling, and (C) axon guidance, in tg(hsp70l:bmp4) embryos induced at 15 hpf, normalized to controls, as determined by microarray at 21 hpf. Expression level change displayed as log2(Fold change). * adj. p < 0.05, ** adj. p < 0.01, *** adj. p < 0.001. (D–O) In situ hybridization of genes related to axon guidance at 21 hpf in tg(hsp70l:bmp4) embryos and controls induced at 15 hpf. (D,E) sema3d. (F,G) sema3ab. (H,I) lrig1. (J,K) ephb2b. (L–O) rgmd. (D–G,J,K,N,O) Sagittal view, nasal to the left; (H,I,L,M) transverse view. All images are maximum intensity projections; counterstaining with DAPI, scale bar 50 µm. EXPRESSION / LABELING:
PHENOTYPE:
|
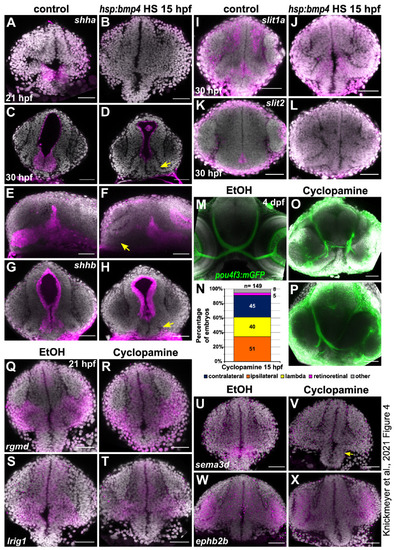
Sonic hedgehog expression is locally inhibited by bmp4 induction and inhibition of Shh signaling results in defective RGC projections. (A–L) In situ hybridization in tg(hsp70l:bmp4) embryos and controls heat shocked at 15 hpf. (A,B) shha expression at 21 hpf in the diencephalon is inhibited by bmp4. (C–F) shha expression at 30 hpf in the anterior domain of the diencephalon (arrow) is inhibited by bmp4. (G,H) shhb expression at 30 hpf in the diencephalon (arrow) is inhibited by bmp4. (I,J) midline slit1a expression at 30 hpf is not changed by bmp4. (K,L) slit2 expression at 30 hpf is inhibited by bmp4. (M–P) RGC projection phenotypes in tg(pou4f3:mGFP) embryos treated with Cyclopamine. (M) Ethanol control. (N) Chart showing the distribution of RGC phenotypes in embryos treated with 100 µM Cyclopamine. Controls had exclusively contralateral projections (n = 61). (O) Ipsilateral RGC projections and (P) unilateral innervation of an optic tectum (“lambda”) in treated embryos. (Q–X) In situ hybridization in (R,T,V,X) embryos treated with 100 µM Cyclopamine and (Q,S,U,W) controls treated with ethanol. (Q,R) Expression of rgmd, (S,T) lrig1. (U,V) Expression of sema3d in the anterior diencephalon is sensitive to Cyclopamine treatment (arrow). (W,X) Expression of ephb2b. All images are maximum intensity projections, DAPI counterstaining, transverse view (except E,F, sagittal view). Scale bars 50 µm. EXPRESSION / LABELING:
PHENOTYPE:
|
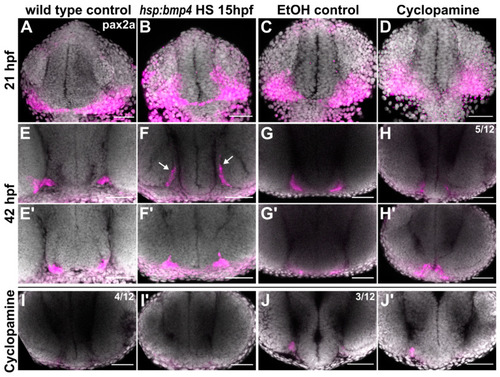
pax2a expression domains are differentially altered in bmp4 induction and Shh inhibition conditions. (A–J) In situ hybridization of pax2a. (A–D) 21 hpf in (A) control and (B) tg(hsp70l:bmp4) embryos after heat shock at 15 hpf; (C) ethanol control and (D) Cyclopamine-treated embryos. (E–J) 42 hpf in (E) control and (F) tg(hsp70l:bmp4) embryos after heat shock at 15 hpf. Part of the pax2a domain extends dorsally (arrows). (G) Ethanol control and (H–J) Cyclopamine-treated embryos with different expression patterns (n = 12); (E’–J’) show a more anterior region in the same embryos as (E–J). All images are maximum intensity projections, DAPI counterstaining, transverse view, scale bars 50 µm. EXPRESSION / LABELING:
PHENOTYPE:
|
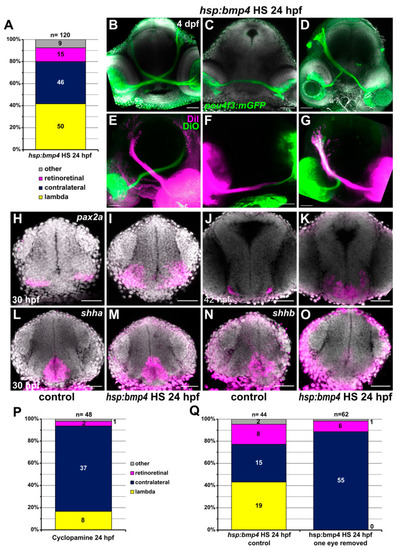
Late induction of |
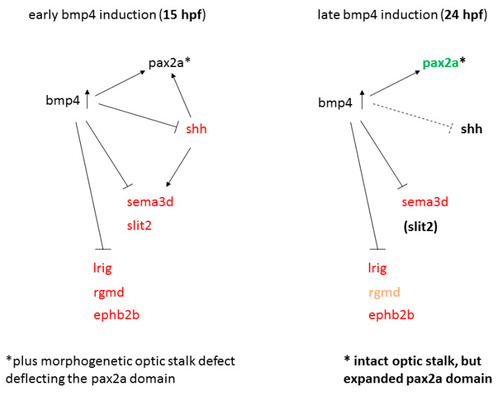
Model of gene regulation in early and late bmp4 induction models. Red and green indicate reduced and increased expression, respectively. |