
- Title
-
A Heterozygous Mutation in Cardiac Troponin T Promotes Ca2+ Dysregulation and Adult Cardiomyopathy in Zebrafish
- Authors
- Kamel, S.M., Koopman, C.D., Kruse, F., Willekers, S., Chocron, S., Bakkers, J.
- Source
- Full text @ J Cardiovasc Dev Dis

ZFIN is incorporating published figure images and captions as part of an ongoing project. Figures from some publications have not yet been curated, or are not available for display because of copyright restrictions. PHENOTYPE:
|
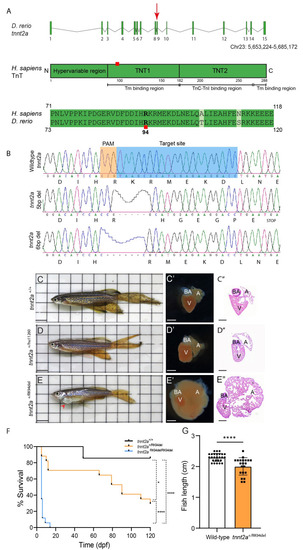
CRISPR/Cas9-induced mutation in tnnt2a promotes the formation of cardiomyopathy in adult zebrafish. (A) Illustration of tnnt2a exons, introns, and chromosome location. Red arrowhead indicates the CRISPR/Cas9 mutation location. The cardiac Troponin T (TnT) human protein is schematically depicted, showing the different regions (hypervariable region, TNT1, and TNT2) that interact with tropomyosin I binding region and Troponin C and I (TnC-TnI) binding region, spanning 288 amino acids. The Arginine mutation site is highlighted with a red square, located on position 94 in zebrafish (D. rerio), which corresponds to the Arginine amino acid 92 in humans (H. sapiens). (B) Two different mutations targeting exon 9 of tnnt2a were identified, either causing a 5 bp frameshift deletion and a truncated form of the protein or a 6 bp in-frame deletion causing a mutated form of the protein. The target sequence for CRISPR/Cas9 is shown in blue and the PAM sequence in orange. The amino acid sequences show the effect of the mutations on the protein. (C–E) Images of 4-month-old adult zebrafish with the genotypes tnnt2a+/+, tnnt2a+/hu11260, or tnnt2a+/RK94del, respectively. Scale bar of 0.5 cm. (C’–E’) Extracted hearts of the respective fish. Scale bar of 100 µm. (C”–E”) Haematoxylin and Eosin (H&E) stainings of heart sections from tnnt2a+/+, tnnt2a+/hu11260, or tnnt2a+/RK94del, respectively. Images were taken at a magnification of 20×, and scale bars are 100 µm. A: atrium, V: ventricle, BA: bulbus arteriosus. (F) Kaplan–Meier curve, displaying the survival of tnnt2a+/+, tnnt2a+/RK94del, and tnnt2aRK94del/RK94del fish during the first 120 days of development (n = 7, 17, and 17, respectively). Statistics: Log-rank (Mantel–Cox) test, mean ± SEM, * p ≤ 0.05, **** p ≤ 0.0001. (G) Measurement of the length of adult fish from tnnt2a+/+ and tnnt2a +/RK94del. Statistics: mean ± SEM, **** p ≤ 0.0001, tnnt2a+/+ n = 26, tnnt2a +/RK94del n = 21, unpaired Students t-test. |
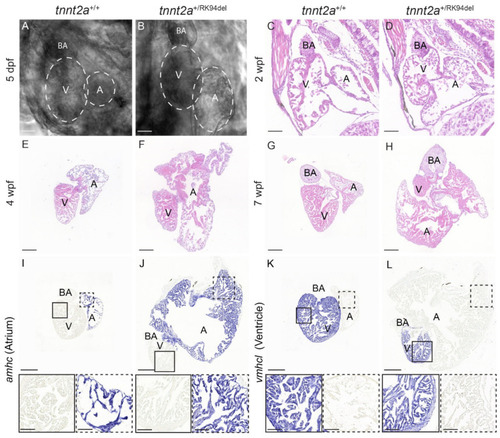
Morphological changes in tnnt2a+/RK94del observed during different stages of development. (A,B) Images of 5 dpf embryonic hearts for tnnt2a+/+ and tnnt2a+/RK94del. (C–H) H&E staining of heart sections of tnnt2a+/+ and tnnt2a+/RK94del at (C,D) 2 weeks post-fertilization, (E,F) 4 weeks post-fertilization, and (G,H) 7 weeks post-fertilization. (I–L) In situ hybridization on adult heart sections of tnnt2a+/+a nd tnnt2a+/RK94del stained for (I,J) amhc, a marker of atrial cells, and (K,L) vmhcl, a marker for adult zebrafish ventricular cells. Images were taken at a magnification of 20×. Scale bars are 100 µm (A–F), 50 µm (G–I), and 200 µm for whole-heart tile scans (I–L) with 50 µm for zoom-in regions. A: atrium, V: ventricle, BA: bulbus arteriosus. |
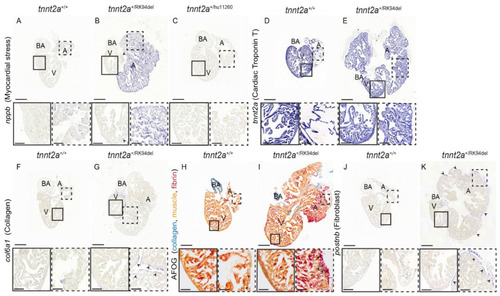
Hearts of adult tnnt2a+/RK94del display increased myocardial stress and fibrosis. (A–C) In situ hybridization on 4-month-old adult heart sections of tnnt2a+/+, tnnt2a+/RK94del, and tnnt2a+/hu11260 stained for nppb, a marker of myocardial stress. In situ hybridization on adult heart sections of tnnt2a+/+ and tnnt2a+/RK94del stained for (D,E) tnnt2a, to mark cardiac Troponin T expression, and (F,G) col6a1, which marks collagen. (H,I) AFOG staining, which marks collagen in blue, muscle in orange, and fibrin in red of tnnt2a+/+ and tnnt2a+/RK94del. (J,K) In situ hybridization on adult heart sections of tnnt2a+/+ and tnnt2a+/RK94del stained for postnb, to mark fibroblasts. Images were taken at a magnification of 20×, except for (H,I) where magnification was at 60×. Scale bars are 200 µm for whole-heart tile scans, 50 µm for zoom-in regions, and 20 µm for zoom-in regions of H, I. A: atrium, V: ventricle, BA: bulbus arteriosus. |
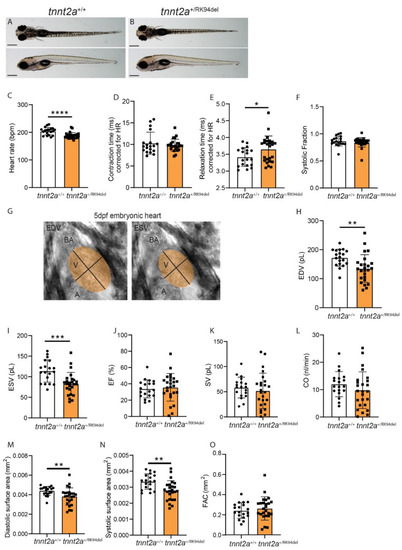
Embryos of tnnt2a+/RK94del show decreased heart rate accompanied by decreased ventricular diastolic and systolic volumes, as well as increased relaxation time. Side view and top view of 5 dpf (A) tnnt2a+/+ and (B) tnnt2a+/RK94del embryos. (C–F) Bar graph of contractility parameters, including heart rate, contraction time, relaxation time, and systolic fraction for tnnt2a+/+ and tnnt2a+/RK94del. (G) For hemodynamic parameters, we used ImageJ to fit an ellipse over the ventricle in every recording, both at end-diastole (left) and end-systole (right). (H–L) Bar graphs of hemodynamic parameters, including end-diastolic volume (EDV), end-systolic volume (ESV), ejection fraction (EF), stroke volume (SV), and cardiac output (CO). (M–O) Bar graphs of surface area parameters: diastolic surface area, systolic diastolic surface area, and fractional area change (FAC). Scale bar: 100 µm. Statistics: mean ± SEM, * p ≤ 0.05, ** p ≤ 0.01, *** p ≤ 0.001, **** p ≤ 0.0001, tnnt2a+/+ n = 19, tnnt2a+/RK94del n = 24, unpaired Students t-test. PHENOTYPE:
|
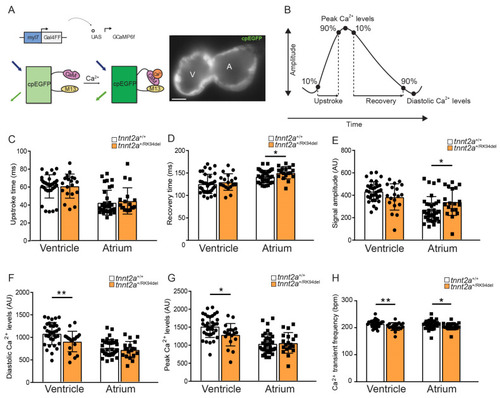
tnnt2a+/RK94del mutation causes intracellular calcium dysregulation in zebrafish embryos. (A) DNA construct and sensor dynamics of GCaMP6f (left panel). GCaMP6f was placed under the control of the myl7 promoter to restrict its expression to the heart, where the Gal4FF-UAS system amplifies its expression. GCaMP6f consists of a circularly permutated enhanced green fluorescence protein (cpEGFP) fused to calmodulin (CaM) and the M13 peptide. Upon the increase of intracellular calcium (Ca2+), CaM binds to M13, causing increased brightness of cpEGFP. This is visualized using a high-speed epifluorescence microscope, where movies of 5 dpf non-contracting GCaMP6f embryonic hearts were recorded (left panel). (B) Schematic representation of Ca2+ transient parameters examined from the recorded GCaMP6f signals. (C–G) Bar graphs of the different Ca2+ transient parameters for tnnt2a+/+ and tnnt2a+/RK94del, including upstroke time, recovery time, signal amplitude, diastolic Ca2+ levels, and peak Ca2+ levels. (H) Frequency of Ca2+ transients tnnt2a+/+ and tnnt2a+/RK94del. AU: arbitrary unit. Statistics: mean ± SEM, * p ≤ 0.05, ** p ≤ 0.01, tnnt2a+/+ n = 34, tnnt2a+/RK94del n = 19, unpaired Students t-test. A: atrium, V: ventricle. PHENOTYPE:
|
|
Unillustrated author statements |