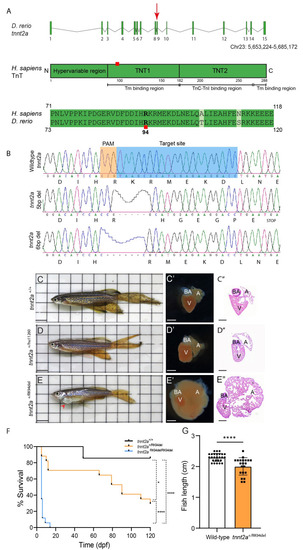
CRISPR/Cas9-induced mutation in tnnt2a promotes the formation of cardiomyopathy in adult zebrafish. (A) Illustration of tnnt2a exons, introns, and chromosome location. Red arrowhead indicates the CRISPR/Cas9 mutation location. The cardiac Troponin T (TnT) human protein is schematically depicted, showing the different regions (hypervariable region, TNT1, and TNT2) that interact with tropomyosin I binding region and Troponin C and I (TnC-TnI) binding region, spanning 288 amino acids. The Arginine mutation site is highlighted with a red square, located on position 94 in zebrafish (D. rerio), which corresponds to the Arginine amino acid 92 in humans (H. sapiens). (B) Two different mutations targeting exon 9 of tnnt2a were identified, either causing a 5 bp frameshift deletion and a truncated form of the protein or a 6 bp in-frame deletion causing a mutated form of the protein. The target sequence for CRISPR/Cas9 is shown in blue and the PAM sequence in orange. The amino acid sequences show the effect of the mutations on the protein. (C–E) Images of 4-month-old adult zebrafish with the genotypes tnnt2a+/+, tnnt2a+/hu11260, or tnnt2a+/RK94del, respectively. Scale bar of 0.5 cm. (C’–E’) Extracted hearts of the respective fish. Scale bar of 100 µm. (C”–E”) Haematoxylin and Eosin (H&E) stainings of heart sections from tnnt2a+/+, tnnt2a+/hu11260, or tnnt2a+/RK94del, respectively. Images were taken at a magnification of 20×, and scale bars are 100 µm. A: atrium, V: ventricle, BA: bulbus arteriosus. (F) Kaplan–Meier curve, displaying the survival of tnnt2a+/+, tnnt2a+/RK94del, and tnnt2aRK94del/RK94del fish during the first 120 days of development (n = 7, 17, and 17, respectively). Statistics: Log-rank (Mantel–Cox) test, mean ± SEM, * p ≤ 0.05, **** p ≤ 0.0001. (G) Measurement of the length of adult fish from tnnt2a+/+ and tnnt2a +/RK94del. Statistics: mean ± SEM, **** p ≤ 0.0001, tnnt2a+/+ n = 26, tnnt2a +/RK94del n = 21, unpaired Students t-test.
|
