
- Title
-
Bi-allelic variants in HOPS complex subunit VPS41 cause cerebellar ataxia and abnormal membrane trafficking
- Authors
- Sanderson, L.E., Lanko, K., Alsagob, M., Almass, R., Al-Ahmadi, N., Najafi, M., Al-Muhaizea, M.A., Alzaidan, H., AlDhalaan, H., Perenthaler, E., van der Linde, H.C., Nikoncuk, A., Kühn, N.A., Antony, D., Owaidah, T.M., Raskin, S., Vieira, L.G.D.R., Mombach, R., Ahangari, N., Silveira, T.R.D., Ameziane, N., Rolfs, A., Alharbi, A., Sabbagh, R.M., AlAhmadi, K., Alawam, B., Ghebeh, H., AlHargan, A., Albader, A.A., Binhumaid, F.S., Goljan, E., Monies, D., Mustafa, O.M., Aldosary, M., AlBakheet, A., Alyounes, B., Almutairi, F., Al-Odaib, A., Aksoy, D.B., Basak, A.N., Palvadeau, R., Trabzuni, D., Rosenfeld, J.A., Karimiani, E.G., Meyer, B.F., Karakas, B., Al-Mohanna, F., Arold, S.T., Colak, D., Maroofian, R., Houlden, H., Bertoli-Avella, A.M., Schmidts, M., Barakat, T.S., van Ham, T.J., Kaya, N.
- Source
- Full text @ Brain
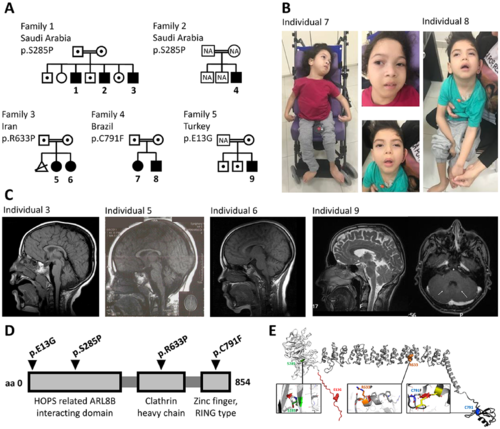
Bi-allelic variants in VPS41 lead to a progressive developmental disorder with cerebellar dysfunction. (A) Pedigrees of Families 1–5 with affected Subjects 1–9 (closed symbols), with carriers indicated by dots. (B) Frontal facial and full body photographs of Subjects 7 (female) and 8 (male) in a sitting position; both children were wheelchair-bound. Individuals present with hypotonic face, slightly low-set ears, long eyelashes, full cheeks, small, open mouth with full lips. Full body images illustrate failure to thrive, marked hypotonia in Subject 8, spastic thoracic deformity, and flexion contractures in the upper limbs of the Subject 7. (C) Brain MRI of affected Subjects 3, 5, 6 and 9, showing midline vermian atrophy (Subject 3), mild cerebellar vermis hypoplasia/atrophy (Subject 5), milder (compared to the sibling Subject 5) cerebellar vermis hypoplasia/atrophy (Subject 6) and no overt cerebellar volume reduction (first image) but bilateral hyperintensities in the nucleus caudatus area (arrows, second image) (Subject 9). (D) Schematic overview of the VPS41 protein with identified variants indicated. (E) Structural protein modelling showing that VPS41 contains an acidic N-terminal extension (residues 1–29, red), a WD40 β-propeller domain (residues 30–361, white), a central superhelix structure composed of clathrin heavy-chain repeats (CHCR; residues 362–781, grey) and a C-terminal RING zinc-finger (787–852, black). The complete structure is shown in the centre as a ribbon drawing, with the mutated residues highlighted as coloured sphere models. The insets show the structural context of each mutation, except for E13G, which is located in a flexible region. The other insets show the original residue as a stick model, coloured as in the overview. The mutated residue is shown superimposed as a white stick model. Size and orientation of the red discs show the extent and direction of steric clashes. |
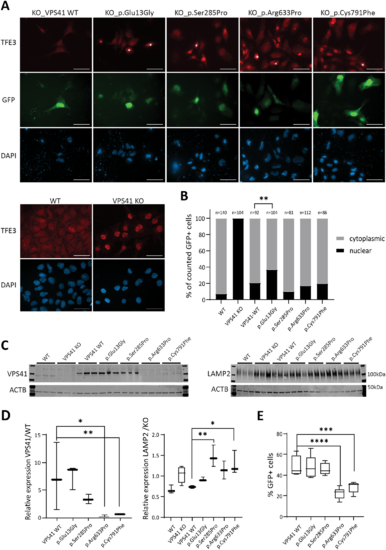
VPS41 variants contribute to impaired lysosomal functions in vitro.(A) Immunocytochemistry assessing TFE3 in rescue experiments using transient expression of wild-type (WT) and mutant VPS41-t2a-GFP in VPS41 KO ESC. Transfected cells are marked by GFP and GFP+ cells showing no TFE3 relocalization to the cytoplasm are marked with white asterisks. Nuclei are counterstained with DAPI. Scale bars = 50 µm. (B) Quantification of A counting a minimum of 80 GFP+ cells from three replicates. ***P = 0.0001, binomial test (expected distribution based on relocalization upon transfection with the wild-type construct). (C) Western blotting detecting VPS41 (endogenous VPS41 99 kDa, V5-tag-VPS41 105 kDa, input 30 µg) and LAMP2 (100–120 kDa, input 20 µg), in wild-type and VPS41 KO ESCs and VPS41 KO ESCs transiently rescued with wild-type or mutant VPS41. (D) Quantification of C, *P < 0.05; **P < 0.01; ***P < 0.001 one-way ANOVA, multiple comparison test of mutant constructs to the wild-type. (E) Percentage of GFP+ cells upon transient transfections of VPS41-KO cells with VPS41-GFP plasmid spiked with mCherry, expressing wild-type or mutant VPS41. ***P = 0.0006, ****P < 0.0001, one-way ANOVA, multiple comparison test of mutant constructs to the wild-type; >17 000 cells were analysed per sample. |
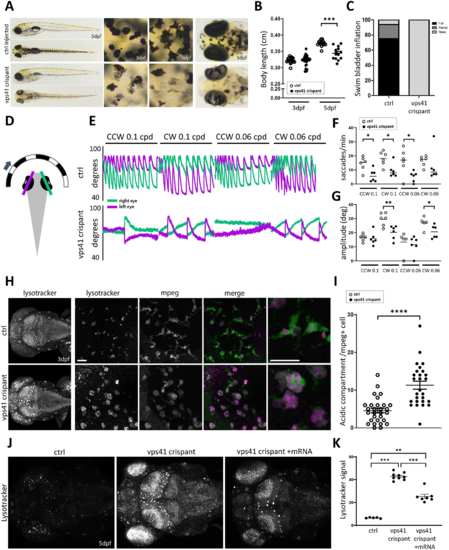
VPS41 disease modelling in zebrafish recapitulates lysosomal abnormalities and indicates microglial and cerebellar dysfunction. (A) Gross morphology of vps41 crispant versus control embryos at 5 dpf. Magnified views of the skin and eyes show abnormal melanocyte morphology and reduced pigmentation in both the skin melanocytes and retinal pigment epithelium. (B) Measurements of body length at 3 and 5 dpf, suggesting a reduced growth rate in vps41 crispants versus controls (n = 15 each). (C) At 5 dpf, swim bladders were not visible in any of the vps41 crispant embryos, while being fully developed by this time in the majority of controls (n = 50). (D) Schematic of the OKR experiment, indicating the eye angles measured. (E) Representative OKR traces for vps41 crispant and control embryos under four different conditions. (F) Quantification of saccades produced in response to visual stimuli (n = 6 for each condition). (G) Average saccade amplitude per trial, taken from left eye traces (n = 6 for each condition). (H) LysoTracker™ staining of 3 dpf embryos, revealing increased acidification of vps41 crispant brains that is largely concentrated within Mpeg1+ cell (microglia) compartments. Scale bars = 20 µm. (I) Quantification of acidic compartments within microglia in the brain at 3 dpf (6–8 cells counted per embryo, n = 4 embryos each). (J) Compared to control injected embryos at 5 dpf, vps41 crispants show a remarkably increased level of acidity across the entire brain, detected using LysoTracker™, that is significantly reduced when embryos are additionally injected with wild-type vps41 mRNA at the 1–2 cell stage. (K) Quantification of the LysoTracker™ signal intensity across the whole brain of 5 dpf control, vps41 and vps41+ mRNA-injected embryos (n = 5 controls, n = 9 vps41, and n = 7 vps41+ mRNA). Data-points in B, F, G and I are individual measurements (circles) and mean (bars) and error bars indicate SEM. CW = clockwise; CCW = counterclockwise; cpd = cycles per degree; dpf = days post-fertilization. *P < 0.05; **P < 0.01; ***P < 0.001; ****P < 0.0001. PHENOTYPE:
|

ZFIN is incorporating published figure images and captions as part of an ongoing project. Figures from some publications have not yet been curated, or are not available for display because of copyright restrictions. |