
|
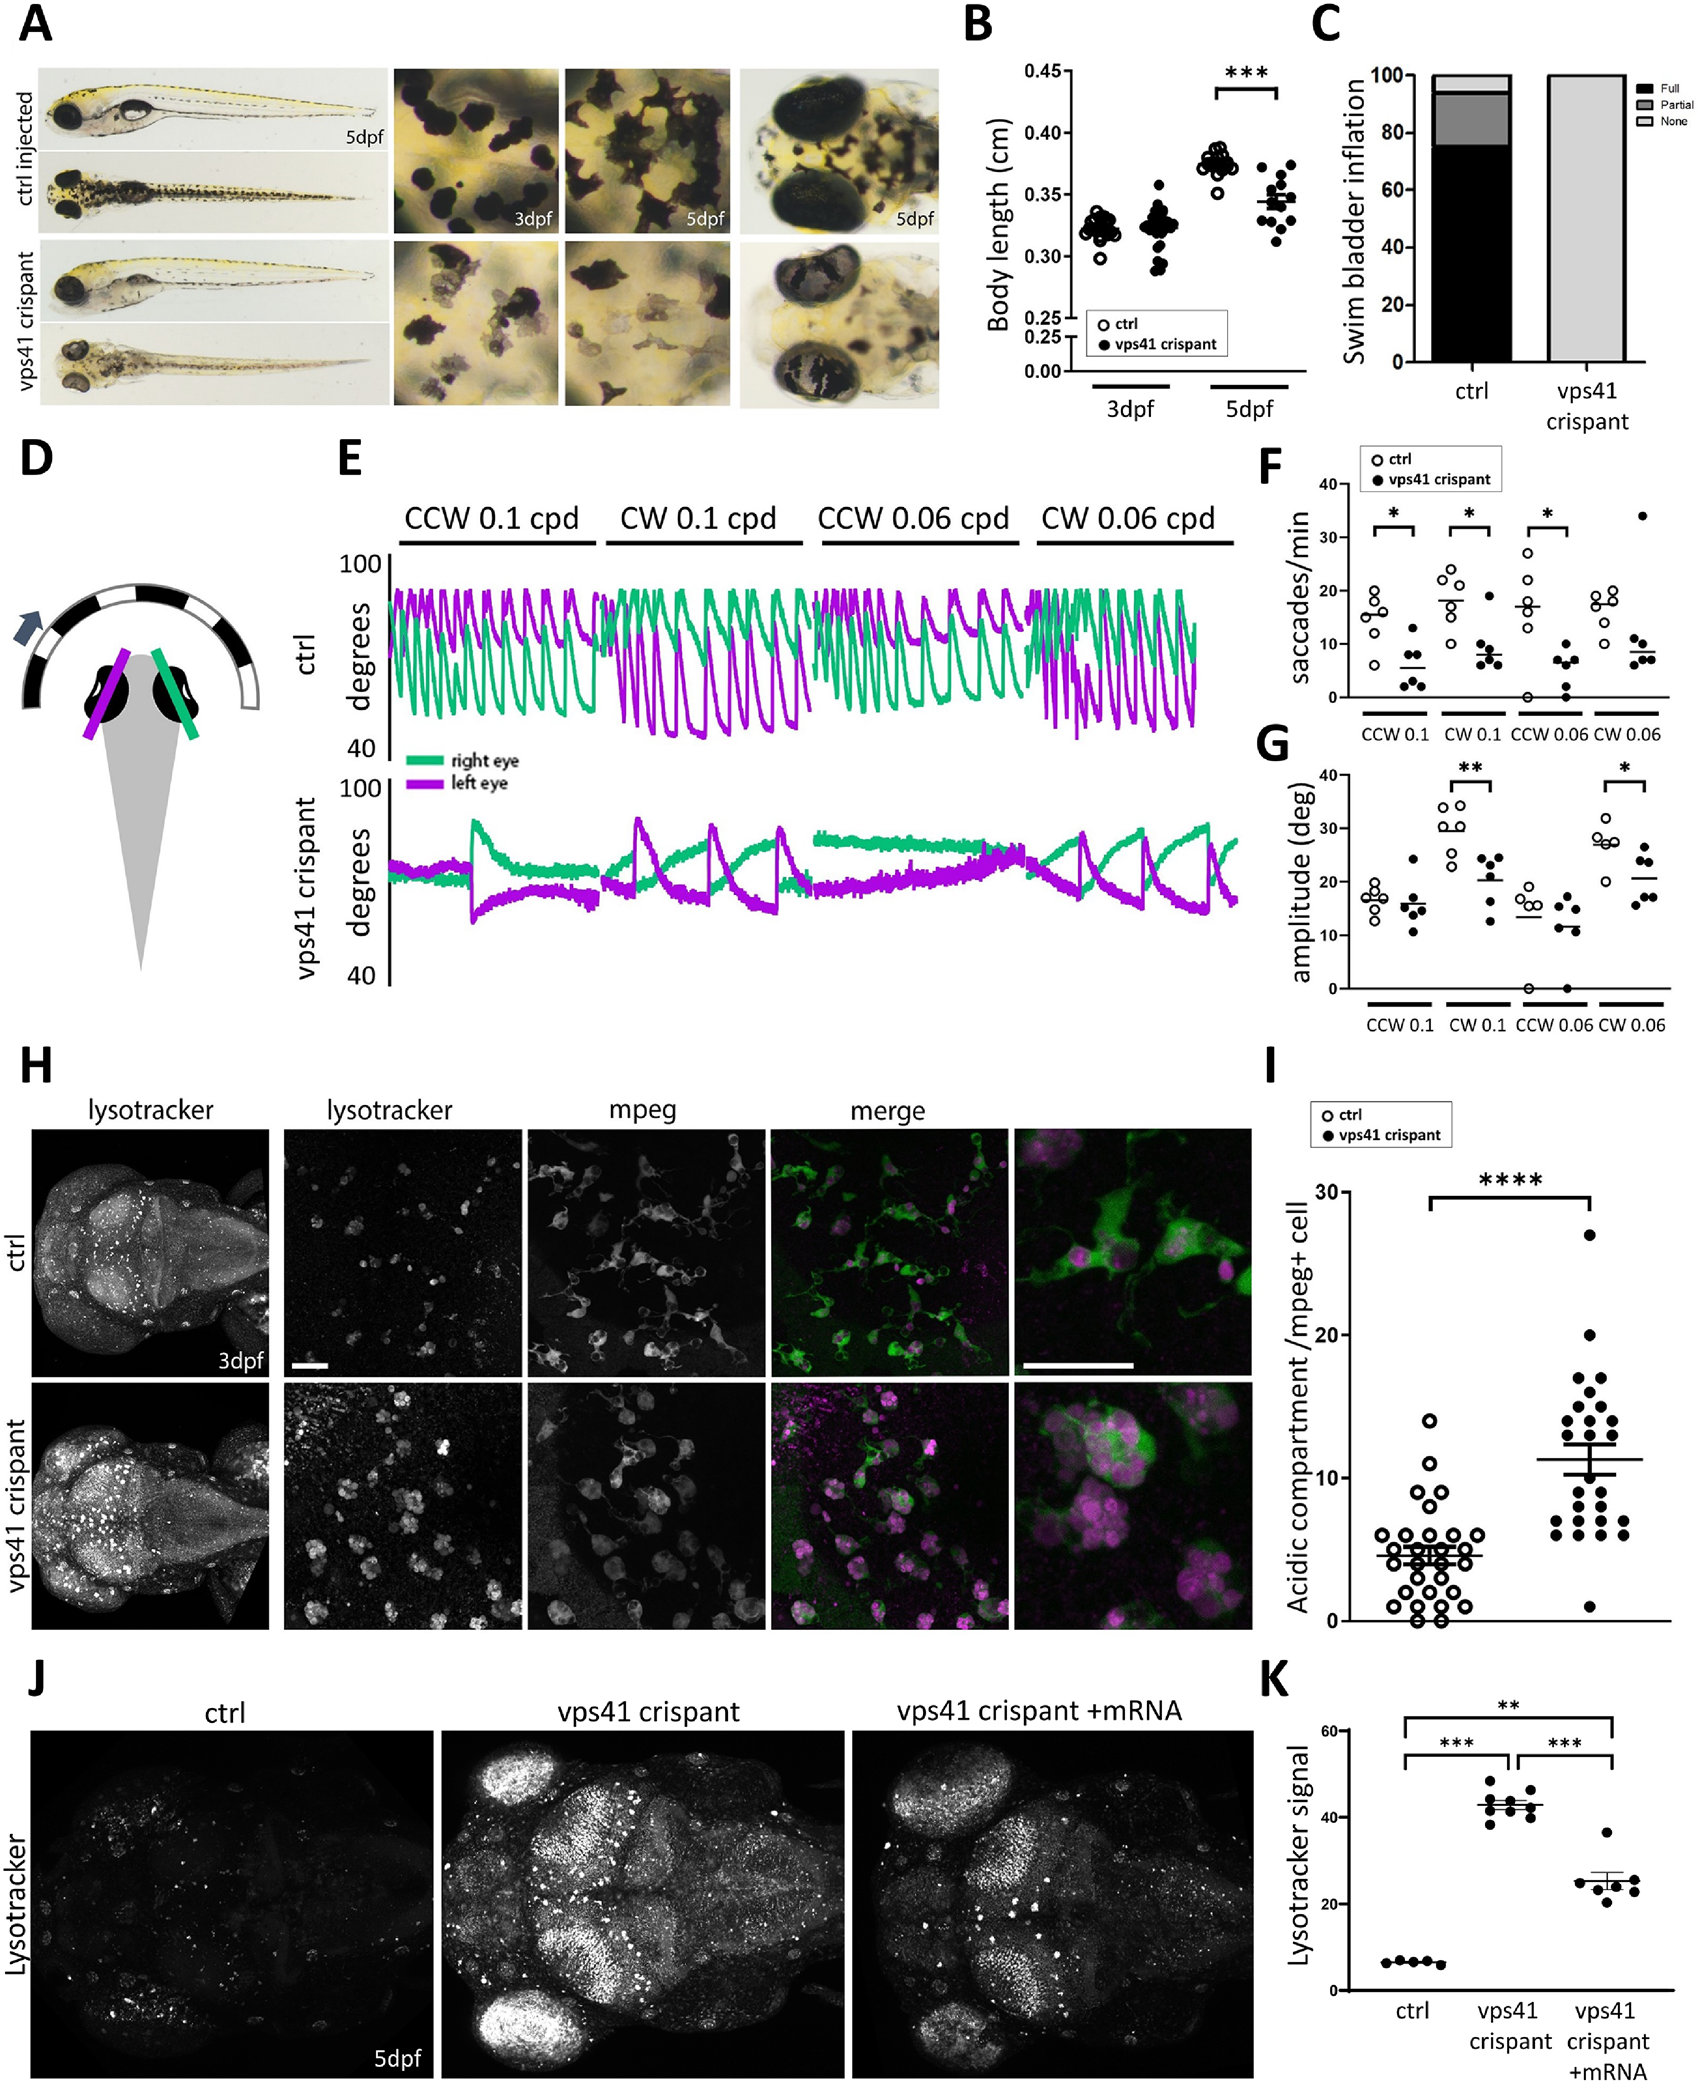
Fig. 3 VPS41 disease modelling in zebrafish recapitulates lysosomal abnormalities and indicates microglial and cerebellar dysfunction. (A) Gross morphology of vps41 crispant versus control embryos at 5 dpf. Magnified views of the skin and eyes show abnormal melanocyte morphology and reduced pigmentation in both the skin melanocytes and retinal pigment epithelium. (B) Measurements of body length at 3 and 5 dpf, suggesting a reduced growth rate in vps41 crispants versus controls (n = 15 each). (C) At 5 dpf, swim bladders were not visible in any of the vps41 crispant embryos, while being fully developed by this time in the majority of controls (n = 50). (D) Schematic of the OKR experiment, indicating the eye angles measured. (E) Representative OKR traces for vps41 crispant and control embryos under four different conditions. (F) Quantification of saccades produced in response to visual stimuli (n = 6 for each condition). (G) Average saccade amplitude per trial, taken from left eye traces (n = 6 for each condition). (H) LysoTracker™ staining of 3 dpf embryos, revealing increased acidification of vps41 crispant brains that is largely concentrated within Mpeg1+ cell (microglia) compartments. Scale bars = 20 µm. (I) Quantification of acidic compartments within microglia in the brain at 3 dpf (6–8 cells counted per embryo, n = 4 embryos each). (J) Compared to control injected embryos at 5 dpf, vps41 crispants show a remarkably increased level of acidity across the entire brain, detected using LysoTracker™, that is significantly reduced when embryos are additionally injected with wild-type vps41 mRNA at the 1–2 cell stage. (K) Quantification of the LysoTracker™ signal intensity across the whole brain of 5 dpf control, vps41 and vps41+ mRNA-injected embryos (n = 5 controls, n = 9 vps41, and n = 7 vps41+ mRNA). Data-points in B, F, G and I are individual measurements (circles) and mean (bars) and error bars indicate SEM. CW = clockwise; CCW = counterclockwise; cpd = cycles per degree; dpf = days post-fertilization. *P < 0.05; **P < 0.01; ***P < 0.001; ****P < 0.0001.