
Fig. 1
- ID
- ZDB-FIG-210506-18
- Publication
- Sanderson et al., 2021 - Bi-allelic variants in HOPS complex subunit VPS41 cause cerebellar ataxia and abnormal membrane trafficking
- Other Figures
- All Figure Page
- Back to All Figure Page
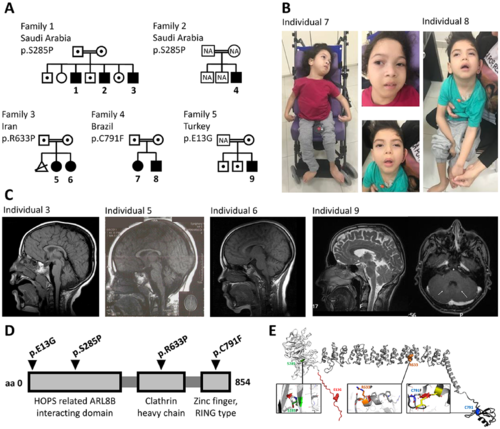
Bi-allelic variants in VPS41 lead to a progressive developmental disorder with cerebellar dysfunction. (A) Pedigrees of Families 1–5 with affected Subjects 1–9 (closed symbols), with carriers indicated by dots. (B) Frontal facial and full body photographs of Subjects 7 (female) and 8 (male) in a sitting position; both children were wheelchair-bound. Individuals present with hypotonic face, slightly low-set ears, long eyelashes, full cheeks, small, open mouth with full lips. Full body images illustrate failure to thrive, marked hypotonia in Subject 8, spastic thoracic deformity, and flexion contractures in the upper limbs of the Subject 7. (C) Brain MRI of affected Subjects 3, 5, 6 and 9, showing midline vermian atrophy (Subject 3), mild cerebellar vermis hypoplasia/atrophy (Subject 5), milder (compared to the sibling Subject 5) cerebellar vermis hypoplasia/atrophy (Subject 6) and no overt cerebellar volume reduction (first image) but bilateral hyperintensities in the nucleus caudatus area (arrows, second image) (Subject 9). (D) Schematic overview of the VPS41 protein with identified variants indicated. (E) Structural protein modelling showing that VPS41 contains an acidic N-terminal extension (residues 1–29, red), a WD40 β-propeller domain (residues 30–361, white), a central superhelix structure composed of clathrin heavy-chain repeats (CHCR; residues 362–781, grey) and a C-terminal RING zinc-finger (787–852, black). The complete structure is shown in the centre as a ribbon drawing, with the mutated residues highlighted as coloured sphere models. The insets show the structural context of each mutation, except for E13G, which is located in a flexible region. The other insets show the original residue as a stick model, coloured as in the overview. The mutated residue is shown superimposed as a white stick model. Size and orientation of the red discs show the extent and direction of steric clashes. |