FIGURE SUMMARY
Title

Zebrafish Ski7 tunes RNA levels during the oocyte-to-embryo transition

Authors
Cabrera-Quio, L.E., Schleiffer, A., Mechtler, K., Pauli, A.
Source
Full text @ PLoS Genet.

Ski7 mutant fish produce reduced numbers of developing offspring.

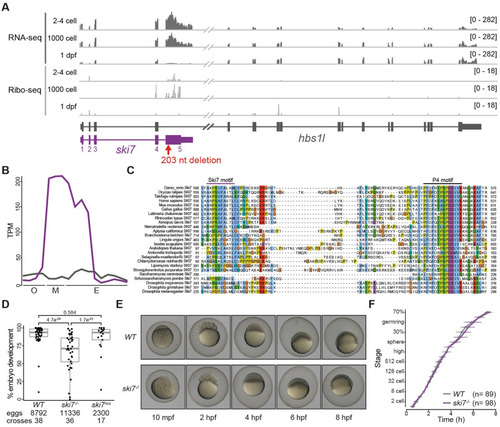
(A) Expression profile of the hbs1l (gray)/ski7 (purple) locus during embryogenesis. Ski7 is highly expressed in the early embryo. RNA-seq is shown in dark gray and Ribo-seq in light gray; numbers in brackets indicate expression levels; the red arrow indicates the site of the ski7 mutation. (B) Ski7 mRNA peaks during the oocyte-to-embryo transition. Transcript-specific quantification of ski7 (purple) and hbs1l (gray) RNA from polyA+ RNA-seq during oogenesis (O: oocyte stages I-IV), in mature eggs (M: unactivated, activated, fertilized) and during embryogenesis (E: 2–4 cell, 256 cell, 1000 cell, oblong, dome, shield, bud, 1 dpf, 2 dpf, 5 dpf [34]); TPM, transcripts per million. (C) Ski7 protein is highly conserved. Protein sequence alignment of the conserved C-terminus of Ski7 across different organisms. The two most conserved motifs, the Ski7-like motif and the Patch (P4)-like motif, are highlighted. (D) Ski7-/- fish produce fewer embryos that develop. Number of embryos that progress beyond the one-cell stage of wild-type (WT), ski7-/- and ski7res (ski7-/-; tg[actb2:ski7-GFP]) fish. Transgenic ski7-GFP rescues the decreased number of viable progeny observed in ski7-/- fish. P-adjusted values from Kruskal-Wallis with Dunn’s multiple comparison test. (E) Ski7-/- embryos develop normally. Representative images of WT and ski7-/- embryos from 10 minutes post-fertilisation (mpf) to 8 hours post-fertilisation (hpf). (F) Quantification of embryo development in WT and ski7-/- embryos. Ski7-/- embryos that undergo cell cleavage develop at normal rate.

EXPRESSION / LABELING:
Gene:
Fish:
Anatomical Term:
Stage Range: 4-cell to Prim-5

Zebrafish Ski7 interacts with the cytoplasmic exosome.

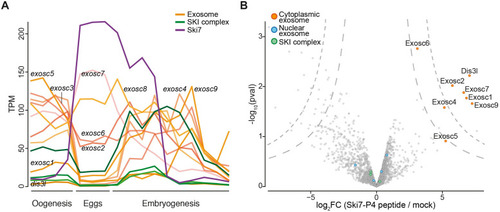
(A) mRNA expression levels of ski7 (purple), subunits of the cytoplasmic RNA exosome (orange) and the SKI complex (green). PolyA+ RNA-seq during oogenesis (oocyte stages I-IV), mature eggs (unactivated, activated, fertilized) and embryogenesis (2–4 cell, 256 cell, 1000 cell, oblong, dome, shield, bud, 1 dpf, 2 dpf, 5 dpf [34]); TPM, transcripts per million. (B) Ski7 associates with the cytoplasmic exosome in early embryos. Volcano plot of Ski7-P4-like peptide-interacting proteins from wild-type zebrafish embryo lysates (128-512-cell stage) identified by mass spectrometry. Subunits of the cytoplasmic exosome (orange) are enriched, while nuclear exosome auxiliary factors (blue) and the SKI complex (green) are not enriched.

EXPRESSION / LABELING:
Genes:
Fish:
Anatomical Term:
Stage: 128-cell

Ski7 modulates the transcriptome during the oocyte-to-embryo transition.

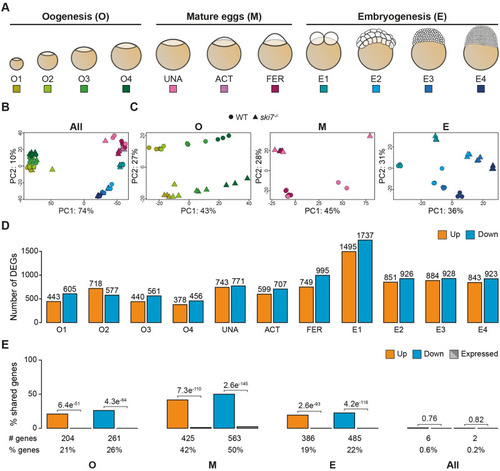
(A) Schematic representation of the stages used for RNA-seq during three consecutive developmental periods: oogenesis, mature eggs and embryogenesis. (B, C) Principal Component Analyses (PCA) of all time points (B) or individual periods (C) used for the polyA+ RNA-seq comparison of WT (circle) and ski7-/- (triangle). (B) Samples show clustering by developmental time. (C) Samples within each period (oogenesis, mature eggs, and embryogenesis) are separated by time and genotype. The colour code corresponds to the different stages from Fig 3A. (D) Differentially expressed genes (DEGs) identified per stage based on polyA+ RNA-Seq data (orange: up-regulated in ski7-/- mutants; blue: down-regulated in ski7-/- mutants). (E) Percentage of shared DEGs (orange: up-regulated; blue: down-regulated) and expression-matched unchanged genes in wild type (gray) per period (oogenesis, eggs, embryogenesis) and during the full time-course (All). P-values from Pearson’s chi-squared test with Yates continuity correction from comparison of the number of up- or down-regulated genes versus expression-matched genes.

Genes overexpressed in the <italic>ski7</italic> mutants are lowly expressed.

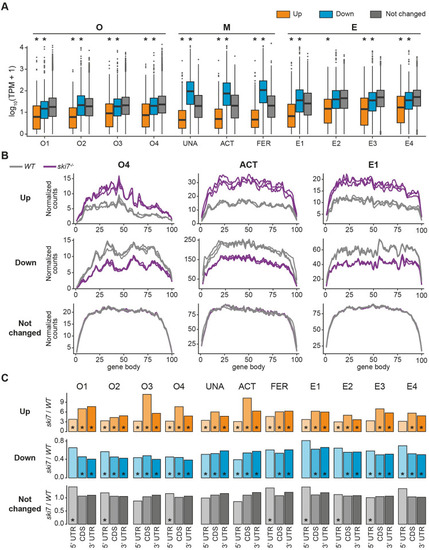
(A) Genes up-regulated in the absence of Ski7 show low expression levels in wild type. Expression levels of DEGs in wild type for every stage of the time course, as measured by transcripts per million (TPM). * indicates p-value < 0.01 from Wilcoxon test in comparison to unchanged genes. (B) Metagene profiles of up-regulated (top), down-regulated (middle), and unchanged genes (bottom) of wild type and ski7-/- mutants at a representative stage for each period during the oocyte-to-embryo transition (oogenesis = O4, mature eggs = activated eggs, embryogenesis = E1). WT, gray; ski7-/-, purple. (C) Up-regulated genes have higher read density towards their 3’ end. Ratio of read density of ski7-/-/WT per gene body region (5’ UTR, CDS, 3’ UTR) for all stages covered in this study. * p-value < 0.05; Wilcoxon test of read density of ski7-/- vs. read density of WT per region.

Absence of Ski7 confers increased resistance to reductive stress.

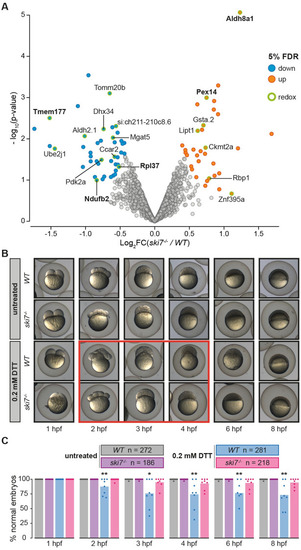
(A) Volcano plot of proteins identified by tandem mass tag mass spectrometry (TMT-MS) from wild-type and ski7-/- mutant embryos at 4 hours post-fertilization. Significantly up- and down-regulated proteins are coloured in orange and blue, respectively. Proteins associated with oxidation-reduction processes are highlighted (green circle) and their name is displayed. Proteins, whose RNA was also identified as differentially expressed based on RNA-seq (DEGs), are highlighted in bold. (B) Ski7-/- mutant embryos show increased resistance to DTT-treatment. Representative images of the development of wild-type and ski7-/- embryos incubated in the absence (untreated) or presence of 0.2 mM DTT. The red box highlights the time-frame during which wild-type embryos show the most obvious aberrant morphogenesis. (C) Quantification of developmental abnormalities upon treatment with 0.2 mM DTT during embryogenesis (hpf, hours post-fertilization). Each dot represents the quantification of an independent experiment (* = p-adjusted < 0.05; ** = p-adjusted < 0.01 from Kruskal-Wallis with Dunn’s multiple comparison test compared to WT untreated on each time point).

PHENOTYPE:
Fish:
Observed In:
Stage Range: 64-cell to 75%-epiboly
Acknowledgments
This image is the copyrighted work of the attributed author or publisher, and ZFIN has permission only to display this image to its users. Additional permissions should be obtained from the applicable author or publisher of the image. Full text @ PLoS Genet.